


was formed on 20.05 at 07:30:33 (UTC+0)
signal strength 4 of 5
signal strength 4 of 5
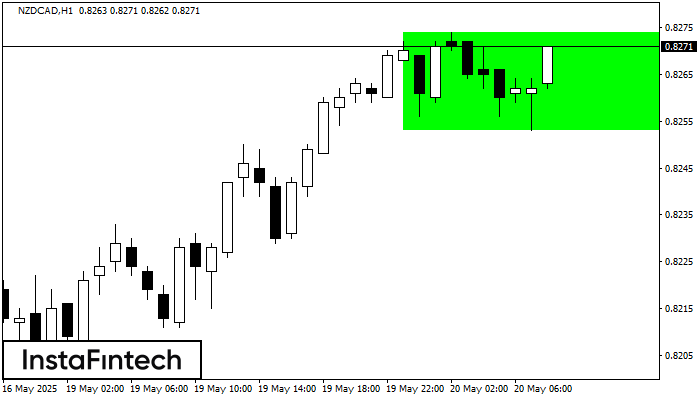
According to the chart of H1, NZDCAD formed the Bullish Rectangle. This type of a pattern indicates a trend continuation. It consists of two levels: resistance 0.8274 and support 0.8253. In case the resistance level 0.8274 - 0.8274 is broken, the instrument is likely to follow the bullish trend.
Figure
Instrument
Timeframe
Trend
Signal Strength


