signal strength 4 of 5

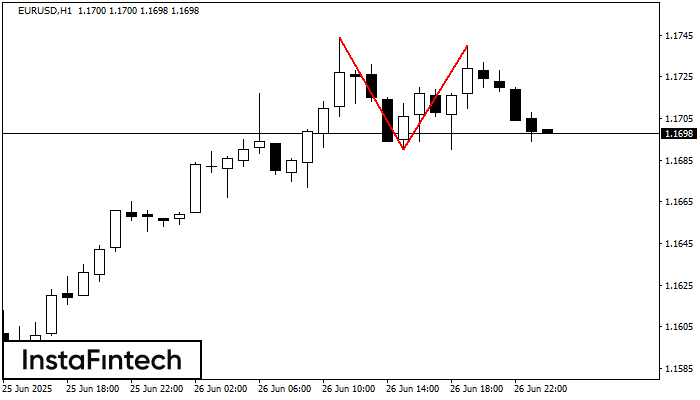
The Double Top pattern has been formed on EURUSD H1. It signals that the trend has been changed from upwards to downwards. Probably, if the base of the pattern 1.1690 is broken, the downward movement will continue.
See Also
- All
- Double Top
- Flag
- Head and Shoulders
- Pennant
- Rectangle
- Triangle
- Triple top
- All
- #AAPL
- #AMZN
- #Bitcoin
- #EBAY
- #FB
- #GOOG
- #INTC
- #KO
- #MA
- #MCD
- #MSFT
- #NTDOY
- #PEP
- #TSLA
- #TWTR
- AUDCAD
- AUDCHF
- AUDJPY
- AUDUSD
- EURCAD
- EURCHF
- EURGBP
- EURJPY
- EURNZD
- EURRUB
- EURUSD
- GBPAUD
- GBPCHF
- GBPJPY
- GBPUSD
- GOLD
- NZDCAD
- NZDCHF
- NZDJPY
- NZDUSD
- SILVER
- USDCAD
- USDCHF
- USDJPY
- USDRUB
- All
- M5
- M15
- M30
- H1
- D1
- All
- Buy
- Sale
- All
- 1
- 2
- 3
- 4
- 5
The technical pattern called Head and Shoulders has appeared on the chart of AUDJPY M5. There are weighty reasons to suggest that the price will surpass the Neckline 96.50/96.53 after
The M5 and M15 time frames may have more false entry points.
Open chart in a new windowAccording to the chart of M5, AUDJPY formed the Bullish Rectangle. The pattern indicates a trend continuation. The upper border is 96.67, the lower border is 96.53. The signal means
The M5 and M15 time frames may have more false entry points.
Open chart in a new windowThe Double Top reversal pattern has been formed on GBPJPY M15. Characteristics: the upper boundary 199.95; the lower boundary 199.78; the width of the pattern is 16 points. Sell trades
The M5 and M15 time frames may have more false entry points.
Open chart in a new window