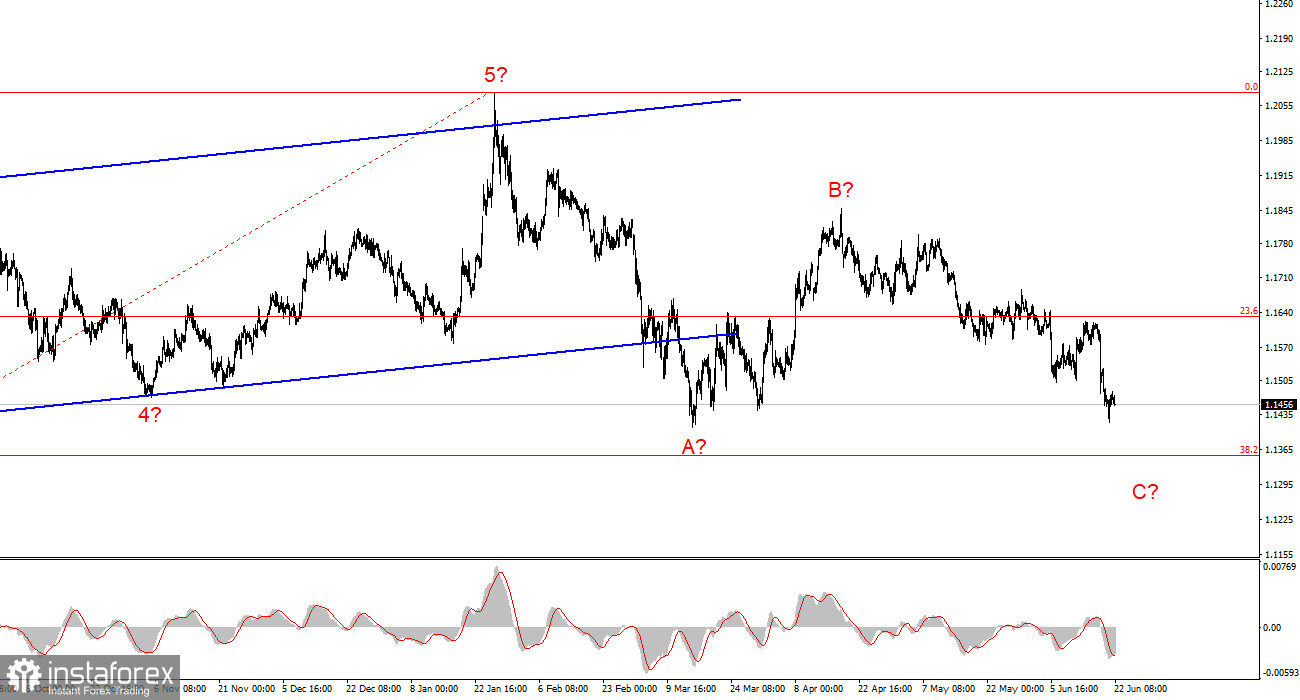
The wave pattern on the 4-hour chart for EUR/USD is becoming more complex. There is still no reason to suggest the cancellation of the upward trend segment (shown in the lower chart), which began in January of last year. However, the trend structure has now taken on a corrective form. From a long-term perspective, wave C is expected to develop, with its low likely positioned below the low of wave A. At the moment, it is difficult to believe in such a strong decline in the euro, as the conflict in the Middle East has ended. However, demand for the U.S. dollar remains elevated, which means the anticipated wave C may still develop fully.
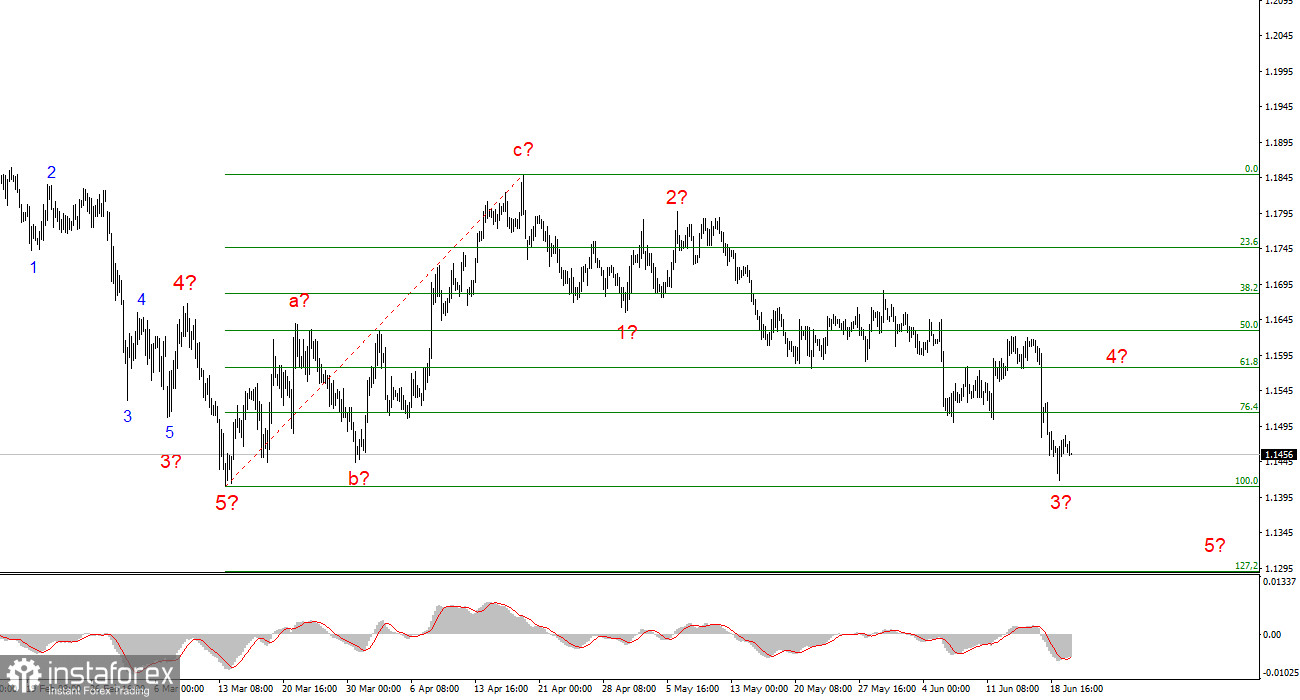
On the lower time frame, I can identify a classic five-wave bearish structure. Once this structure is completed, the instrument may transition into a new upward wave sequence. However, over the past few days, this trend segment has become more complex, with an ambiguous internal structure. Sellers received the necessary news backdrop to continue putting pressure on the instrument.
The EUR/USD pair changed little throughout Friday, as the euro continued to weaken during approximately the first half of the day before recovering later. However, the new week began with renewed demand for the U.S. dollar. The reasons are obvious even without following the news flow. On Sunday evening, the first round of negotiations between Iran and the United States took place at the Swiss resort of B?rgenstock. It remains unclear what specific issues were discussed during the meeting, but over the weekend Tehran once again imposed a blockade on the Strait of Hormuz in response to the continuation of Israeli military operations in Lebanon. Iran stated that the terms of the memorandum of understanding included a complete ceasefire across the region, including southern Lebanon. Therefore, according to Tehran, the agreement was violated, which explains the renewed blockade of the Strait of Hormuz.
At the height of the negotiations, Donald Trump threatened Iran with new military strikes if the Strait of Hormuz is not reopened in the near future and if Tehran refuses to sign a nuclear agreement. The U.S. president also threatened to place the Strait of Hormuz under American control. It should be noted that military experts have repeatedly stated that the United States would be unable to seize Harp Island, force Iran into submission through military means, or, even more so, establish control over an entire strategic waterway. Therefore, Trump's latest threats appear to be little more than an instrument of pressure on Iran, one that has long since lost its effectiveness.
According to media reports, the negotiations focused on keeping the Strait of Hormuz open and monitoring compliance with the ceasefire in Lebanon. As of now, no concrete results have been achieved, while Tehran and Washington continue to issue contradictory statements regarding the status of the strait. For example, according to information from the White House, the strait remains open. The tense situation in the Middle East and the ongoing uncertainty could once again increase demand for the U.S. dollar.
General Conclusions
Based on the EUR/USD analysis, I conclude that the pair remains within a broader upward trend segment (shown in the lower chart), while in the shorter term it remains within a downward trend segment that may be approaching completion. In my view, the current environment may offer an opportunity to consider long positions, although the instrument could still decline below the 1.1400 level as part of wave C. If this assumption proves correct, it may be advisable to wait for additional confirmation. Moreover, geopolitical tensions are intensifying again, which could further support demand for the U.S. dollar.
On the higher time frame, an upward trend segment remains visible, followed by the development of a corrective wave structure. In the near term, wave C is expected to form with targets located near 1.1352, which corresponds to the 38.2% Fibonacci retracement level. Once the A-B-C corrective structure is completed, a new long-term upward trend may begin.
Key Principles of My Analysis:
- Wave structures should be simple and clear. Complex structures are difficult to trade and often undergo changes.
- If there is no confidence in the market situation, it is better to stay out of the market.
- Absolute certainty regarding market direction is impossible. Always use protective Stop Loss orders.
- Wave analysis can be combined with other forms of analysis and trading strategies.