empty
22.01.2024 05:09 PM
Trading Signals for GOLD (XAU/USD) on January 22-23, 2024: buy above $2,020 (21 SMA - 200 EMA)

This image is no longer relevant

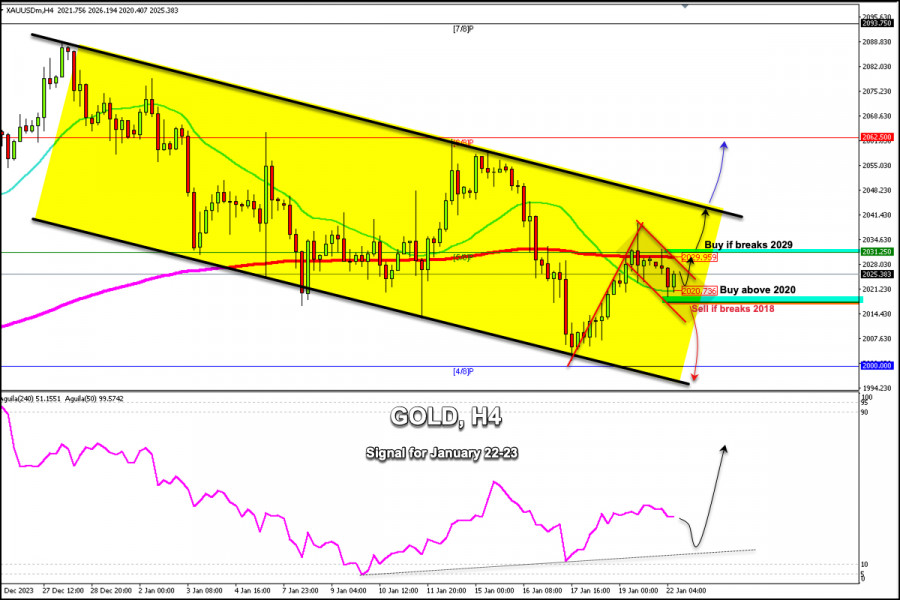
Early in the American session, gold is trading around 2,025.38 and above the 21 SMA 2,020.73. Gold is retreating after having reached the 5/8 Murray zone during the European session. As it did not manage to overcome and consolidate at that level, the metal is now trading at the EMA 200 which acts as a strong resistance.

In the next few hours, we expect gold to continue consolidating above 2,020. If this scenario comes true, we could expect gold to try again to break the 2,029 barrier. Finally, the XAU could reach the top of the downtrend channel forming since December 26 at 2,045. If the bullish force prevails it could reach 6/8 Murray at 2,062.

In case gold breaks below 2,020 and consolidates below 2,018, we could expect a strong bearish acceleration and gold could reach the psychological level of $2,000 and even the one-month support of 1,992.

In the H4 chart, we can see the formation of a pennant pattern. This pattern could be confirmed only if gold breaks and consolidates above 2,031. The target of this pattern could be at 6/8 Murray around 2,062.

As the eagle indicator has been giving a positive signal since January 9, any pullback and if it trades above 2,020, will be seen as an opportunity to buy. In case gold falls below this area, we should avoid buying or taking our losses because the bearish cycle could resume.

Summary
Urgency
Analytic
Dimitrios Zappas
Start trade
รับผลกำไรจากการเปลี่ยนแปลงอัตราสกุลเงินดิจิทัลกับ InstaForex.
ดาวน์โหลด MetaTrader 4 และเปิดการซื้อขายครั้งแรกของคุณ.
  • Grand Choice
    Contest by
    InstaForex
    InstaForex always strives to help you
    fulfill your biggest dreams.
    เข้าร่วมการแข่งขัน


บทความแนะนำ

การคาดการณ์ EUR/USD สำหรับวันที่ 15 กรกฎาคม 2025

บนกราฟรายวัน ราคายังคงยืนอยู่ต่ำกว่าระดับ 1.1692 ในขณะนี้ ตัวบ่งชี้ Marlin กำลังเข้าสู่พื้นที่แนวโน้มขาลง เป้าหมายที่ 1.1535 ได้เปิดกว้างแล้ว การลดลงต่ำกว่าระดับนี้จะเปิดทางสำหรับการลดลงต่อไปสู่ 1.1420 การเพิ่มขึ้นของราคาไปยังขอบเขตบนของช่องราคา (1.1832) ขณะนี้ถือเป็นสถานการณ์ทางเลือก

Laurie Bailey 05:12 2025-07-15 UTC+2

การคาดการณ์ GBP/USD สำหรับวันที่ 15 กรกฎาคม 2025

เมื่อสิ้นสุดวันจันทร์ ค่าเงินปอนด์อังกฤษยังคงอยู่ต่ำกว่าระดับดัชนีสมดุล โดยได้เข้าใกล้ระดับแนวรับเป้าหมายที่ 1.3369 อยู่ 65 จุด เส้นสัญญาณของออสซิลเลเตอร์ Marlin เริ่มมีการเคลื่อนไปทางขึ้น ซึ่งเป็นสัญญาณให้เห็นถึงการปรับฐานที่จะเกิดขึ้น ข้อมูลเงินเฟ้อของสหรัฐฯ ในวันนี้อาจดันค่าเงินปอนด์ไปถึงระดับเป้าหมายได้ การคาดการณ์ดัชนี

Laurie Bailey 05:12 2025-07-15 UTC+2

การคาดการณ์ USD/JPY สำหรับวันที่ 15 กรกฎาคม 2025

หลังจากที่ดีดตัวขึ้นจากแนวรับที่ระดับ 146.11 คู่เงิน USD/JPY ได้มาถึงเส้นบนของรูปแบบลิ่มในกราฟรายวัน และขณะนี้กำลังมุ่งหน้าไปยังระดับแนวต้านที่ 148.66 (ซึ่งเป็นจุดสูงสุดเมื่อวันที่ 12 พฤษภาคม) การรวมตัวอยู่เหนือระดับนี้จะเปิดทางไปสู่ 151.30 ซึ่งสถานการณ์นี้มีความเป็นไปได้ เนื่องจากญี่ปุ่นกำลังจะจัดการเลือกตั้งในสภาสูงวันที่

Laurie Bailey 05:12 2025-07-15 UTC+2

USD/JPY: การวิเคราะห์และการคาดการณ์

คู่เงิน USD/JPY ยังคงอยู่ในช่วงการปรับตัวใกล้ระดับสูงในรอบสามสัปดาห์ ซึ่งได้รับการสนับสนุนจากความแข็งแกร่งของดอลลาร์สหรัฐและสัญญาณในตลาดที่ผสมกัน ดอลลาร์ได้รับแรงหนุนจากคำขู่ของประธานาธิบดี Donald Trump ของสหรัฐอเมริกาในการกำหนดภาษีนำเข้าสูงถึง 30% จากเม็กซิโกและสหภาพยุโรปตั้งแต่วันที่ 1 สิงหาคม ซึ่งส่งผลให้ความต้องการเงินที่เป็นที่ปลอดภัย เช่น เงินเยนญี่ปุ่น

Irina Yanina 12:17 2025-07-14 UTC+2

วิเคราะห์ทางเทคนิคสำหรับสัปดาห์วันที่ 14–19 กรกฎาคม: คู่สกุลเงิน GBP/USD

การวิเคราะห์แนวโน้ม ในสัปดาห์นี้จากระดับ 1.3487 (ราคาปิดของกราฟแท่งเทียนรายสัปดาห์ครั้งที่ผ่านมา) ราคามีแนวโน้มที่จะลดลงต่อเนื่องไปยังเป้าหมายที่ 1.3374 — ซึ่งเป็นระดับการถอยกลับ 23.6% (เส้นประสีแดง) เมื่อทดสอบระดับนี้แล้ว ราคาอาจเริ่มเคลื่อนตัวขึ้นไปยังเป้าหมายที่ 1.3420 — ค่าเฉลี่ยเคลื่อนที่เชิงเส้นแบบทวีผู้หนัก

Stefan Doll 11:40 2025-07-14 UTC+2

การวิเคราะห์ทางเทคนิคสำหรับสัปดาห์ที่ 14–19 กรกฎาคม: คู่สกุลเงิน EUR/USD

การวิเคราะห์แนวโน้ม (รูปที่ 1) สัปดาห์นี้ จากระดับ 1.1689 (ราคาปิดของแท่งเทียนรายสัปดาห์ก่อนหน้า) ตลาดอาจเคลื่อนตัวลงต่อ โดยมีเป้าหมายที่ระดับ 1.1536 ซึ่งเป็นระดับการย่อตัว 38.2% (เส้นประสีน้ำเงิน) เมื่อทดสอบระดับนี้แล้ว ราคาอาจเริ่มปรับตัวขึ้นสู่เป้าหมายที่

Stefan Doll 11:34 2025-07-14 UTC+2

การคาดการณ์สำหรับ EUR/USD ในวันที่ 14 กรกฎาคม 2025

ในวันศุกร์คู่เงิน EUR/USD ฟื้นตัวจากระดับการปรับฐาน Fibonacci ที่ 127.2% ที่ 1.1712 แล้วหันกลับมาในทิศทางที่ได้เปรียบต่อดอลลาร์สหรัฐ และกลับมาลดลงต่อไปยังระดับ 1.1645 การฟื้นตัวจากระดับนี้จะสนับสนุนการกลับมาในทิศทางที่ได้เปรียบต่อยูโรและเพิ่มขึ้นปานกลางไปจนถึงระดับ 1.1712 การปิดระดับที่ต่ำกว่า 1.1645

Samir Klishi 11:31 2025-07-14 UTC+2

การคาดการณ์สำหรับ GBP/USD ณ วันที่ 14 กรกฎาคม 2025

ในกราฟรายชั่วโมง คู่เงิน GBP/USD เมื่อวันศุกร์มีการแกว่งตัวต่ำกว่าระดับ Fibonacci 127.2% ที่ระดับ 1.3527 และต่อมาได้ลดลงอย่างต่อเนื่องไปยังระดับการแก้ไขลำดับถัดไปที่ 100.0% ที่ระดับ 1.3444 การฟื้นตัวจากระดับนี้จะส่งผลดีต่อปอนด์อังกฤษ โดยบ่งชี้ว่าอาจมีการปรับตัวขึ้นอย่างเหมาะสมไปยังระดับ 1.3527

Samir Klishi 11:25 2025-07-14 UTC+2

ค่าเงินปอนด์ยังคงมีโอกาสที่จะปรับตัวลงไปถึงระดับแนวรับในวันจันทร์ที่ 14 กรกฎาคม 2025 ต่อไปได้

GBP/USD – วันจันทร์ที่ 14 กรกฎาคม 2025 ค่าเงิน GBP/USD กำลังอยู่ในสภาวะที่อ่อนแอ ซึ่งยืนยันได้จากการเคลื่อนไหวของราคาที่อยู่ต่ำกว่าเส้นค่าเฉลี่ยเคลื่อนที่ 50 วัน (50-EMA) และยังอยู่ต่ำกว่าเส้นค่าเฉลี่ยเคลื่อนที่

Arief Makmur 07:21 2025-07-14 UTC+2

คู่สกุลเงินสินค้าโภคภัณฑ์ USD/CAD มีแนวโน้มที่จะปรับตัวไปยังจุดหมุนในวันนี้ วันจันทร์ที่ 14 กรกฎาคม 2025

USD/CAD, 14 กรกฎาคม 2025 แม้ว่า Lonnie จะปรับตัวในทิศทางที่เป็นกลาง-ลาดขึ้น แต่ก็ยังมีโอกาสที่คู่สกุลเงิน USD/CAD จะทดสอบระดับ Pivot และแนวรับในวันนี้ ระดับสำคัญ 1. แนวต้าน

Arief Makmur 07:21 2025-07-14 UTC+2
หากไม่สะดวกคุยในตอนนี้
ระบุคำถามไว้ได้ใน แชท.
Widget callback
 

Dear visitor,

Your IP address shows that you are currently located in the USA. If you are a resident of the United States, you are prohibited from using the services of InstaFintech Group including online trading, online transfers, deposit/withdrawal of funds, etc.

If you think you are seeing this message by mistake and your location is not the US, kindly proceed to the website. Otherwise, you must leave the website in order to comply with government restrictions.

Why does your IP address show your location as the USA?

  • - you are using a VPN provided by a hosting company based in the United States;
  • - your IP does not have proper WHOIS records;
  • - an error occurred in the WHOIS geolocation database.

Please confirm whether you are a US resident or not by clicking the relevant button below. If you choose the wrong option, being a US resident, you will not be able to open an account with InstaForex anyway.

We are sorry for any inconvenience caused by this message.