empty
04.07.2025 05:15 AM
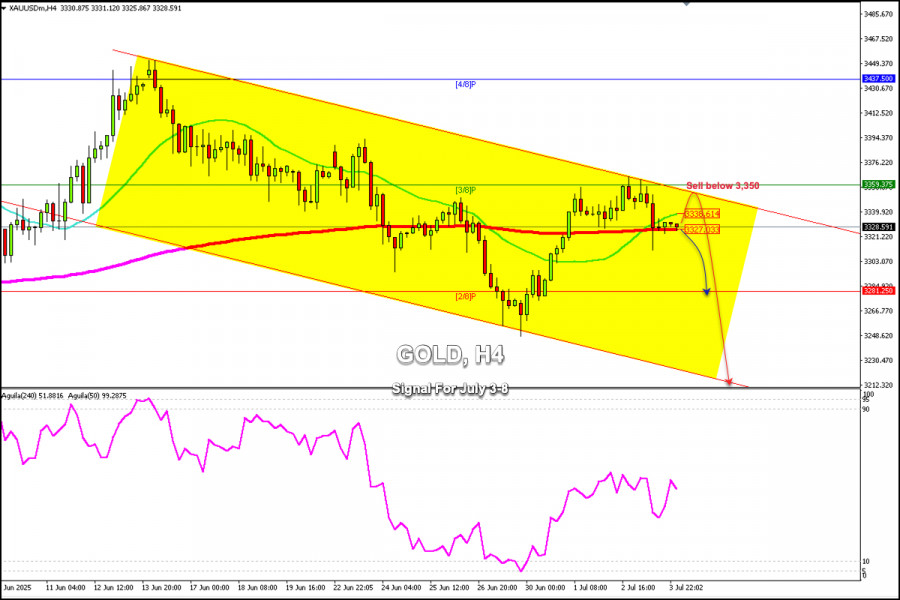
Trading Signals for GOLD (XAU/USD) for July 4-8, 2025: sell below $3,350 (21 SMA - 3/8 Murray)

This image is no longer relevant

Yesterday, during the American session, gold fell after the US employment report surpassed estimates. This data pressured gold, reaching a low of 3,313.

Gold is within a bearish trend channel and, after reaching the top of this channel, made a strong technical correction, in turn supported by solid US employment data, which boosted the dollar and, in turn, put downward pressure on the yellow metal.

Gold encountered strong resistance around the 3/8 Murray level at 3,359. Gold attempted to break this resistance zone three times, but was unsuccessful. Yesterday, after the US data, it made a technical correction, which is likely to continue falling in the coming days.

If gold recovers above the 200 EMA at 3,327, we could expect a pullback to 3,345. This area represents strong resistance and could be seen as a selling opportunity. We can sell with targets at 2/8 Murray, 3,281, and eventually, 3,212.

On the other hand, if gold consolidates below 3,320, the outlook will remain negative, and we could expect a technical correction toward the support at 3,281.

The Eagle indicator is showing a negative signal, so we believe gold could continue its fall in the coming days. However, as long as the price consolidates below 5/8 Murray, the outlook will remain bearish.

Dimitrios Zappas,
InstaForex के विश्लेषणात्मक विशेषज्ञ
© 2007-2025
Summary
Urgency
Analytic
Dimitrios Zappas
Start trade
Earn on cryptocurrency rate changes with InstaForex
Download MetaTrader 4 and open your first trade
  • Grand Choice
    Contest by
    InstaForex
    InstaForex always strives to help you
    fulfill your biggest dreams.
    कॉन्टेस्ट में हिस्सा लें

अनुशंसित लेख

XPD/USD में एक छिपे हुए बुलिश डायवर्जेंस की उपस्थिति आज मजबूती की संभावना प्रदान करती है। बुधवार, 12 नवंबर, 2025।

[XPD/USD] हालांकि RSI न्यूट्रल-बेयरिश स्तर पर है, लेकिन एक छिपे हुए बुलिश डायवर्जेंस के उभरने और दोनों EMA के अभी भी गोल्डन क्रॉस संरचना में होने के कारण, इसके निकटतम

Arief Makmur 18:41 2025-11-12 UTC+2

11 नवंबर, 2025 को GBP/USD पूर्वानुमान

प्रति घंटा चार्ट पर, GBP/USD जोड़ी सोमवार को 1.3186 पर 127.2% रिट्रेसमेंट स्तर तक पहुँची, फिर वापस उछली और थोड़ी गिरावट दर्ज की। आज, इस स्तर से एक और उछाल

Samir Klishi 17:16 2025-11-11 UTC+2

11-13 नवंबर, 2025 के लिए सोने (XAU/USD) के लिए ट्रेडिंग सिग्नल: $4,132 से ऊपर खरीदें (21 SMA - 6/8 मरे)

एच4 चार्ट पर, हम देख सकते हैं कि सोना एक ऊपर की ओर रुझान चैनल के भीतर कारोबार कर रहा है और $4,162 और $4,155 के स्तर पर मजबूत प्रतिरोध

Dimitrios Zappas 17:02 2025-11-11 UTC+2

10-13 नवंबर, 2025 के लिए EUR/USD के ट्रेडिंग सिग्नल: 1.1535 से ऊपर खरीदें (21 SMA - 7/8 मरे)

11 सितंबर को बने एक अवरोही ट्रेंड चैनल में EUR/USD 1.1572 के आसपास कारोबार कर रहा है, और 1.1596 के आसपास मज़बूत प्रतिरोध का सामना कर रहा है। यह उम्मीद

Dimitrios Zappas 19:08 2025-11-10 UTC+2

10-13 नवंबर, 2025 के लिए बिटकॉइन के ट्रेडिंग सिग्नल: $106,250 (200 EMA - 21 SMA) से नीचे बेचें

2/8 मरे स्तर $106,250 पर मजबूत प्रतिरोध का प्रतिनिधित्व करता है, इसलिए हमारा मानना है कि बिटकॉइन को बढ़ते रहने में कठिनाई हो सकती है, और हम आने वाले घंटों

Dimitrios Zappas 18:57 2025-11-10 UTC+2

7 नवंबर, 2025 को EUR/USD पूर्वानुमान

गुरुवार को, EUR/USD जोड़ी यूरोपीय मुद्रा के पक्ष में पलट गई, ऊपर की ओर बढ़ने लगी और 76.4% रिट्रेसमेंट स्तर से ऊपर 1.1517 पर समेकित हो गई। इस प्रकार

Samir Klishi 20:11 2025-11-07 UTC+2

7 नवंबर, 2025 को GBP/USD पूर्वानुमान

प्रति घंटा चार्ट पर, GBP/USD जोड़ी गुरुवार को 1.3024 पर 200.0% रिट्रेसमेंट स्तर से पलटाव के बाद बढ़ती रही। दिन के अंत तक, यह जोड़ी 1.3110–1.3139 के प्रतिरोध स्तर

Samir Klishi 20:09 2025-11-07 UTC+2

3 नवंबर, 2025 को GBP/USD पूर्वानुमान

प्रति घंटा चार्ट पर, GBP/USD जोड़ी ने शुक्रवार को अपनी गिरावट जारी रखी, लेकिन मंदी के रुझान 1.3110–1.3139 के समर्थन स्तर से नीचे समेकित नहीं हो पाए। इस प्रकार

Samir Klishi 19:05 2025-11-03 UTC+2

EUR/USD. 3–8 नवंबर, 2025 के सप्ताह के लिए तकनीकी विश्लेषण

पिछले हफ़्ते, यह जोड़ी नीचे की ओर बढ़ी और लगभग 23.6% रिट्रेसमेंट स्तर – 1.1506 (लाल धराशायी रेखा) को पार कर गई, फिर ऊपर की ओर बढ़ी और साप्ताहिक कैंडल

Stefan Doll 18:23 2025-11-03 UTC+2

अमेरिकी डॉलर इंडेक्स में बुलिश हिडन डाइवर्जेंस के प्रकट होने का संकेत है कि निकट भविष्य में इसमें मजबूती आ सकती है। गुरुवार, 30 अक्टूबर, 2025।

[यूएसडी डॉलर इंडेक्स] – [गुरुवार, 30 अक्टूबर 2025] EMA(50) और EMA(200) के बीच डेथ क्रॉस के प्रतिच्छेदन और RSI पर हिडन डाइवर्जेंस के प्रकट होने के साथ, #USDX में अपने

Arief Makmur 10:55 2025-10-30 UTC+2
अभी बात नहीं कर सकते?
अपना प्रश्न पूछें बातचीत.
Widget callback
 

Dear visitor,

Your IP address shows that you are currently located in the USA. If you are a resident of the United States, you are prohibited from using the services of InstaFintech Group including online trading, online transfers, deposit/withdrawal of funds, etc.

If you think you are seeing this message by mistake and your location is not the US, kindly proceed to the website. Otherwise, you must leave the website in order to comply with government restrictions.

Why does your IP address show your location as the USA?

  • - you are using a VPN provided by a hosting company based in the United States;
  • - your IP does not have proper WHOIS records;
  • - an error occurred in the WHOIS geolocation database.

Please confirm whether you are a US resident or not by clicking the relevant button below. If you choose the wrong option, being a US resident, you will not be able to open an account with InstaForex anyway.

We are sorry for any inconvenience caused by this message.