сила сигнала 3 из 5

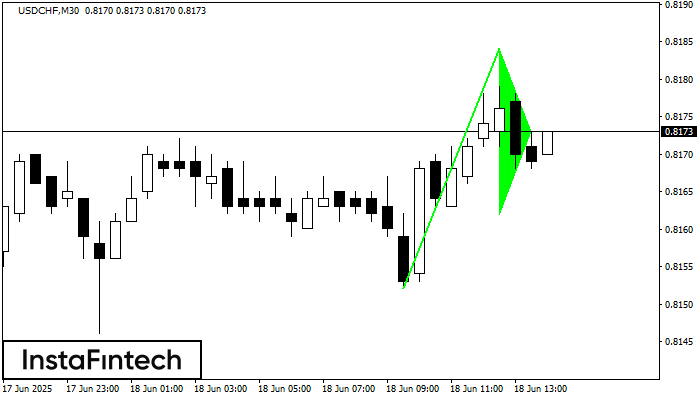
На графике USDCHF M30 сформировался паттерн «Бычий вымпел», который относится к фигуре продолжения тренда. Можно предполагать, что, в случае фиксации цены выше максимума вымпела 0.8184, возможно дальнейшее восходящее движение.
Шунингдек кўринг
- Все
- Вымпел
- Голова и плечи
- Двойная вершина
- Прямоугольник
- Треугольник
- Тройная вершина
- Флаг
- Все
- #AAPL
- #AMZN
- #Bitcoin
- #EBAY
- #FB
- #GOOG
- #INTC
- #KO
- #MA
- #MCD
- #MSFT
- #NTDOY
- #PEP
- #TSLA
- #TWTR
- AUDCAD
- AUDCHF
- AUDJPY
- AUDUSD
- EURCAD
- EURCHF
- EURGBP
- EURJPY
- EURNZD
- EURRUB
- EURUSD
- GBPAUD
- GBPCHF
- GBPJPY
- GBPUSD
- GOLD
- NZDCAD
- NZDCHF
- NZDJPY
- NZDUSD
- SILVER
- USDCAD
- USDCHF
- USDJPY
- USDRUB
- Все
- M5
- M15
- M30
- H1
- D1
- Все
- Покупка
- Продажа
- Все
- 1
- 2
- 3
- 4
- 5
The Bearish Flag pattern has been formed on the chart AUDJPY M15 which signals that the downward trend will continue. If the price breaks below the low at 95.45, then
The M5 and M15 time frames may have more false entry points.
Open chart in a new windowThe Bearish pennant pattern has formed on the AUDJPY M15 chart. It signals potential continuation of the existing trend. Specifications: the pattern’s bottom has the coordinate of 95.45; the projection
The M5 and M15 time frames may have more false entry points.
Open chart in a new windowThe Double Bottom pattern has been formed on AUDCAD M5. Characteristics: the support level 0.8900; the resistance level 0.8951; the width of the pattern 51 points. If the resistance level
The M5 and M15 time frames may have more false entry points.
Open chart in a new window