empty
10.01.2023 07:36 PM
Technical analysis of EUR/USD for January 10, 2023

This image is no longer relevant

Overview :

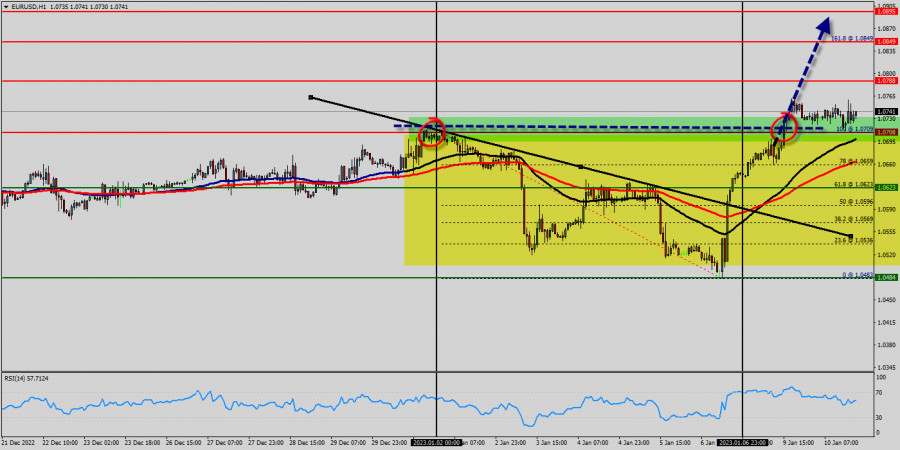
The EUR/USD pair broke resistance at 1.0623 which turned into strong support yesterday. This level coincides with 61.8% of Fibonacci retracement which is expected to act as major support today. Equally important, the RSI is still signaling that the trend is upward, while the moving average (100) is headed to the upside.

On the one-hour chart, immediate support is seen at 1.0659, which coincides with a ratio of 78% Fibonacci retracement. Currently, the price is moving in a bullish channel. This is confirmed by the RSI indicator signaling that we are still in a bullish trending market. The price is still above the moving average (100) and (50),

Accordingly, the bullish outlook remains the same as long as the EMA 100 is pointing to the uptrend. This suggests that the pair will probably go above the daily pivot point (1.0623) in the coming hours. The EUR/USD pair will demonstrate strength following a breakout of the high at 0.9958. Consequently, the market is likely to show signs of a bullish trend.

In other words, buy orders are recommended above 1.0708 with the first target at 1.0788. Then, the pair is likely to begin an ascending movement to 1.0788 mark and further to 1.0849 levels.

The level of 1.0849 will act as strong resistance, and the double top is already set at 1.0788.

On the other hand, the daily strong support is seen at 1.0623. If the GBP/USD pair is able to break out the level of 1.0623 , the market will decline further to 1.0503 (daily support 2).

Summary
Urgency
Analytic
Mourad El Keddani
Start trade
انسٹافاریکس کے ساتھ کرپٹو کرنسی کی معاملاتی تبدیلیوں سے کمائیں۔
میٹا ٹریڈر 4 ڈاؤن لوڈ کریں اور اپنی پہلی ٹریڈ کھولیں۔
  • Grand Choice
    Contest by
    InstaForex
    InstaForex always strives to help you
    fulfill your biggest dreams.
    مقابلہ میں شامل ہوں

تجویز کردہ مضامین

یو ایس ڈی / جے پی وائے۔ تجزیہ اور پیشن گوئی

تکنیکی نقطہ نظر سے، جگہ کی قیمتیں ہفتہ وار تجارتی حد کے اندر رہتی ہیں۔ تاہم، مکمل بیئرش کنسولیڈیشن کی تصدیق کرنا قبل از وقت ہے، کیونکہ روزانہ چارٹ

Irina Yanina 16:04 2025-08-08 UTC+2

اگست 7-9 2025 کے لیے یورو / یو ایس ڈی کے لیے تجارتی سگنل: 1.1680 سے نیچے فروخت کریں (200 ای ایم اے - 7/8 مرے)

یہ کہ 1.1590 سے نیچے فیصلہ کن بریک یورو کے لیے تیز تکنیکی تصحیح کا اشارہ دے سکتا ہے، اس لیے یورو / یو ایس ڈی کے 1.1474 پر 6/8

Dimitrios Zappas 19:54 2025-08-07 UTC+2

اگست 7-9 2025 کے لیے بٹ کوائن کے لیے تجارتی سگنل: $117,110 سے نیچے فروخت (200 ای ایم اے - 21 ایس ایم اے)

دوسری طرف، اگر بٹ کوائن 114,500 پر واقع 200 ای ایم اے سے نیچے آتا ہے اور اس علاقے کے نیچے مضبوط ہوتا ہے، تو اس کے 112,500 تک پہنچنے

Dimitrios Zappas 19:49 2025-08-07 UTC+2

اگست 7-9 2025 کے لیے سونے (ایکس اے یو / یو ایس ڈی) کے لیے تجارتی سگنل: $3,400 یا $3,373 سے کم فروخت کریں (21 ایس ایم اے - 7/8 مرے)

اگر سونا تیزی سے اپ ٹرینڈ چینل کو توڑتا ہے اور 21 ایس ایم اے سے نیچے مستحکم ہوتا ہے، تو اسے فروخت کرنے کے ایک موقع

Dimitrios Zappas 19:47 2025-08-07 UTC+2

AUD/JPY. Analysis and Forecast

اے یو ڈی / جے پی وائے پئیر خریداری کی دلچسپی کو اپنی طرف متوجہ کرنے کے لیے جدوجہد کر رہا ہے، 95.00 کی نفسیاتی سطح کے قریب تجارت

Irina Yanina 14:23 2025-08-05 UTC+2

اگست 4-7 2025 کے لیے یورو / یو ایس ڈی کے لیے تجارتی سگنل: 1.1602 سے نیچے فروخت کریں (200 ای ایم اے - 7/8 مرے)

اگر یورو ٹوٹ جاتا ہے اور 1.1602 سے اوپر مستحکم ہوتا ہے، تو ہم بحالی کی توقع کر سکتے ہیں، اور یورو / یو ایس ڈی 1.1718

Dimitrios Zappas 21:03 2025-08-04 UTC+2

اگست 4-7 2025 کے لیے بٹ کوائن (بی ٹی سی / یو ایس ڈی) کے لیے تجارتی سگنل: $115,625 سے نیچے فروخت کریں یا $114,086 سے اوپر خریدیں (200 ای ایم اے - 21 ایس ایم اے)

اگر بٹ کوائن اپنے بیئرش چکر کو دوبارہ شروع کرتا ہے، تو ہم اس کے $114,000 سے نیچے گرنے کی توقع کر سکتے ہیں۔ اس کے بعد، یہ 4/8

Dimitrios Zappas 20:59 2025-08-04 UTC+2

اگست 4-7 2025 کے لیے سونے (ایکس اے یو / یو ایس ڈی) کے لیے تجارتی سگنل: $3,385 سے نیچے فروخت (21 ایس ایم اے - 6/8 مرے)

آنے والے گھنٹوں میں، ہم 6/8 مرے کی سطح پر 3,359 پر ہدف کے ساتھ 3,385 سے نیچے سونا فروخت کر سکتے ہیں۔ اگر سونا اس علاقے سے نیچے

Dimitrios Zappas 20:56 2025-08-04 UTC+2

ایکس اے یو / یو ایس ڈی : تجزیہ اور پیشن گوئی

چارگھنٹے کے چارٹ پر تکنیکی نقطہ نظر سے، 100 پیریڈ سادہ موونگ ایوریج (ایس ایم اے) سے نیچے حالیہ وقفے کو ایک اہم بیئرش سگنل کے طور پر دیکھا

Irina Yanina 19:19 2025-07-30 UTC+2

یورو / جے پی وائے - تجزیہ، پیشن گوئی، اور موجودہ مارکیٹ کی صورتحال

امریکہ اور یورپی یونین کے درمیان ممکنہ طور پر غیر متوازن تجارتی معاہدے پر خدشات کے درمیان یورو نسبتاً کمزور کارکردگی دکھا رہا ہے۔ اس کے علاوہ، مارکیٹ اس ہفتے

Irina Yanina 19:14 2025-07-29 UTC+2
ابھی فوری بات نہیں کرسکتے ؟
اپنا سوال پوچھیں بذریعہ چیٹ.
Widget callback
 

Dear visitor,

Your IP address shows that you are currently located in the USA. If you are a resident of the United States, you are prohibited from using the services of InstaFintech Group including online trading, online transfers, deposit/withdrawal of funds, etc.

If you think you are seeing this message by mistake and your location is not the US, kindly proceed to the website. Otherwise, you must leave the website in order to comply with government restrictions.

Why does your IP address show your location as the USA?

  • - you are using a VPN provided by a hosting company based in the United States;
  • - your IP does not have proper WHOIS records;
  • - an error occurred in the WHOIS geolocation database.

Please confirm whether you are a US resident or not by clicking the relevant button below. If you choose the wrong option, being a US resident, you will not be able to open an account with InstaForex anyway.

We are sorry for any inconvenience caused by this message.