

signal strength 2 of 5
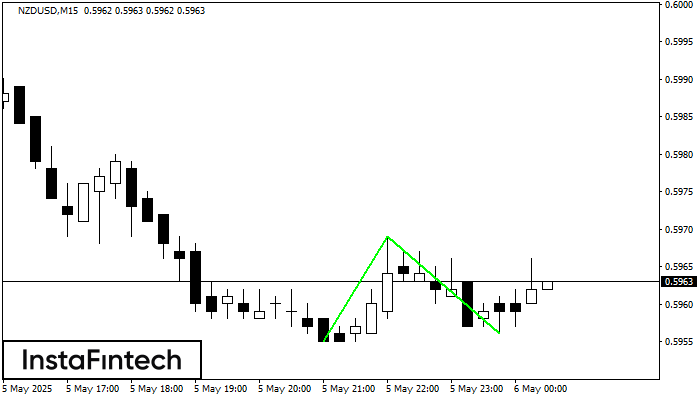
The Double Bottom pattern has been formed on NZDUSD M15. Characteristics: the support level 0.5955; the resistance level 0.5969; the width of the pattern 14 points. If the resistance level is broken, a change in the trend can be predicted with the first target point lying at the distance of 13 points.
The M5 and M15 time frames may have more false entry points.
- All
- Double Top
- Flag
- Head and Shoulders
- Pennant
- Rectangle
- Triangle
- Triple top
- All
- #AAPL
- #AMZN
- #Bitcoin
- #EBAY
- #FB
- #GOOG
- #INTC
- #KO
- #MA
- #MCD
- #MSFT
- #NTDOY
- #PEP
- #TSLA
- #TWTR
- AUDCAD
- AUDCHF
- AUDJPY
- AUDUSD
- EURCAD
- EURCHF
- EURGBP
- EURJPY
- EURNZD
- EURRUB
- EURUSD
- GBPAUD
- GBPCHF
- GBPJPY
- GBPUSD
- GOLD
- NZDCAD
- NZDCHF
- NZDJPY
- NZDUSD
- SILVER
- USDCAD
- USDCHF
- USDJPY
- USDRUB
- All
- M5
- M15
- M30
- H1
- D1
- All
- Buy
- Sale
- All
- 1
- 2
- 3
- 4
- 5
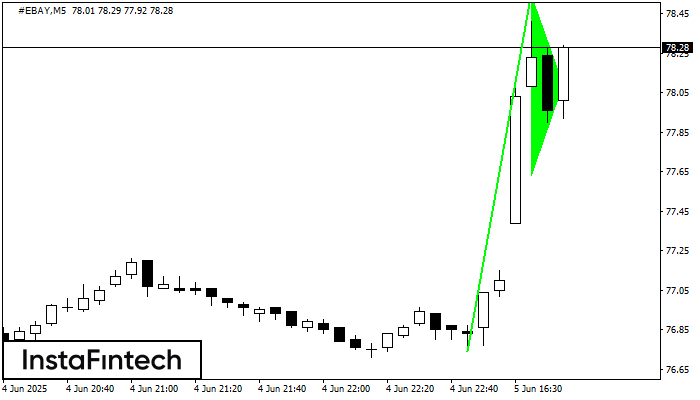
The Bullish pennant pattern is formed on the #EBAY M5 chart. It is a type of the continuation pattern. Supposedly, in case the price is fixed above the pennant’s high
The M5 and M15 time frames may have more false entry points.
Open chart in a new window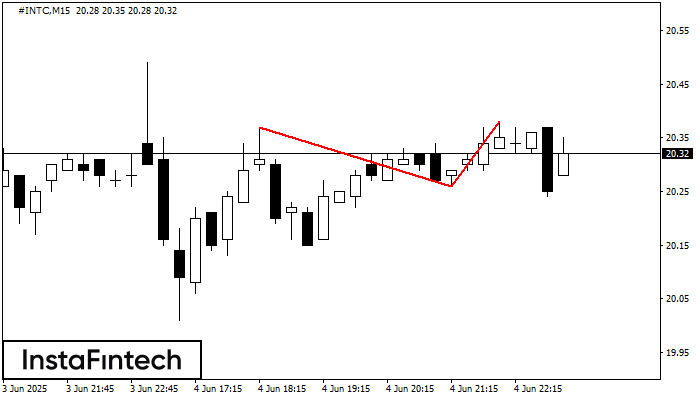
The Double Top pattern has been formed on #INTC M15. It signals that the trend has been changed from upwards to downwards. Probably, if the base of the pattern 20.26
The M5 and M15 time frames may have more false entry points.
Open chart in a new window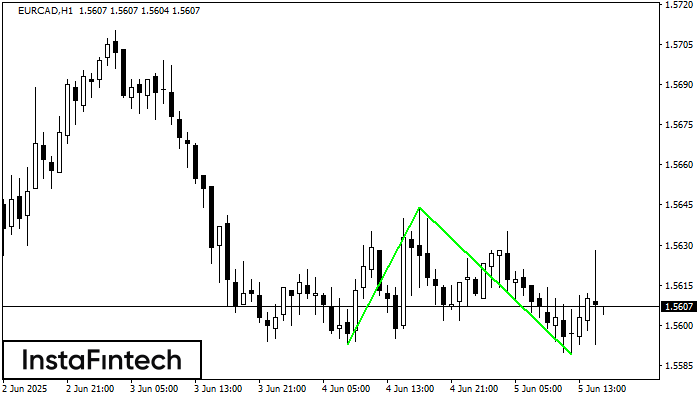
The Double Bottom pattern has been formed on EURCAD H1; the upper boundary is 1.5644; the lower boundary is 1.5589. The width of the pattern is 51 points. In case
Open chart in a new window


