


signal strength 1 of 5
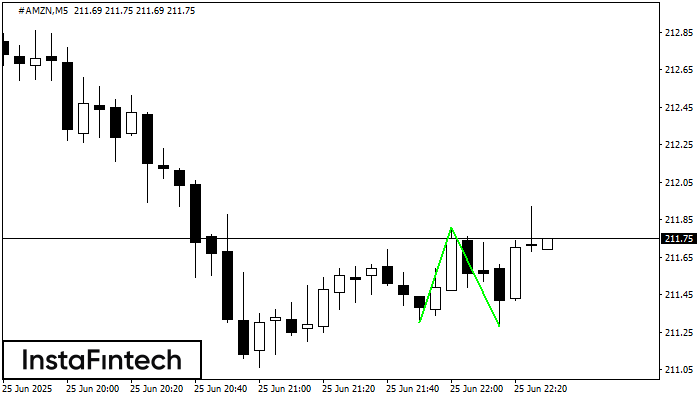
The Double Bottom pattern has been formed on #AMZN M5. This formation signals a reversal of the trend from downwards to upwards. The signal is that a buy trade should be opened after the upper boundary of the pattern 211.81 is broken. The further movements will rely on the width of the current pattern 51 points.
The M5 and M15 time frames may have more false entry points.
See Also
- All
- Double Top
- Flag
- Head and Shoulders
- Pennant
- Rectangle
- Triangle
- Triple top
- All
- #AAPL
- #AMZN
- #Bitcoin
- #EBAY
- #FB
- #GOOG
- #INTC
- #KO
- #MA
- #MCD
- #MSFT
- #NTDOY
- #PEP
- #TSLA
- #TWTR
- AUDCAD
- AUDCHF
- AUDJPY
- AUDUSD
- EURCAD
- EURCHF
- EURGBP
- EURJPY
- EURNZD
- EURRUB
- EURUSD
- GBPAUD
- GBPCHF
- GBPJPY
- GBPUSD
- GOLD
- NZDCAD
- NZDCHF
- NZDJPY
- NZDUSD
- SILVER
- USDCAD
- USDCHF
- USDJPY
- USDRUB
- All
- M5
- M15
- M30
- H1
- D1
- All
- Buy
- Sale
- All
- 1
- 2
- 3
- 4
- 5
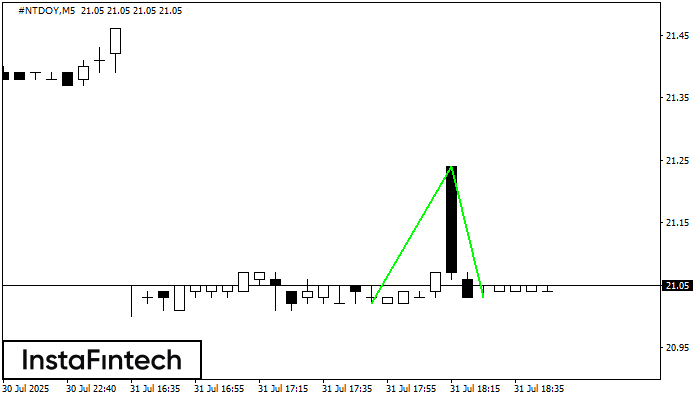
The Double Bottom pattern has been formed on #NTDOY M5. Characteristics: the support level 21.02; the resistance level 21.24; the width of the pattern 22 points. If the resistance level
The M5 and M15 time frames may have more false entry points.
Open chart in a new window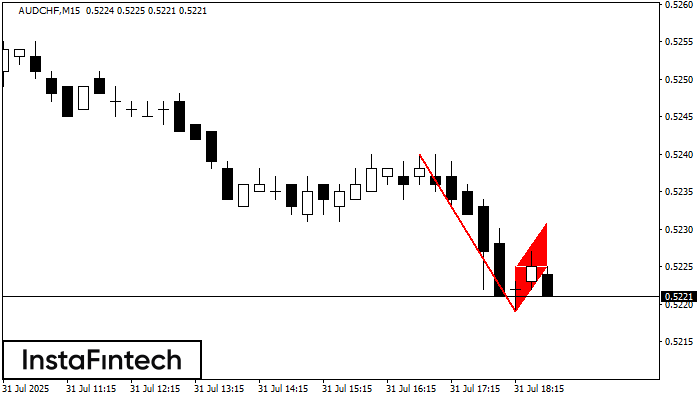
The Bearish Flag pattern has been formed on the chart AUDCHF M15. Therefore, the downwards trend is likely to continue in the nearest term. As soon as the price breaks
The M5 and M15 time frames may have more false entry points.
Open chart in a new window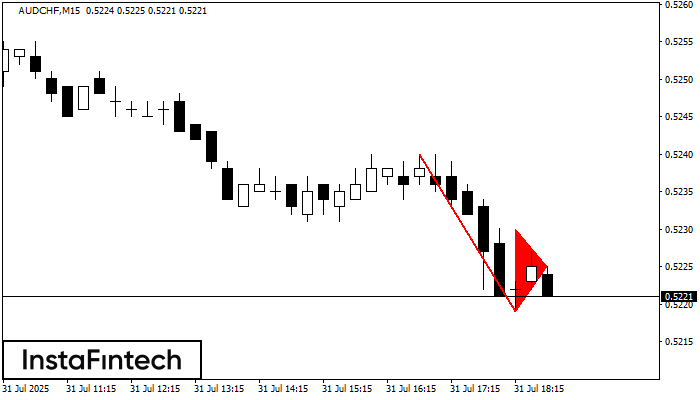
The Bearish pennant pattern has formed on the AUDCHF M15 chart. The pattern signals continuation of the downtrend in case the pennant’s low of 0.5219 is broken through. Recommendations: Place
The M5 and M15 time frames may have more false entry points.
Open chart in a new window


