empty
13.03.2025 12:18 PM
EUR/USD. March 13th. Bulls Are Tired of Playing Along with Trump

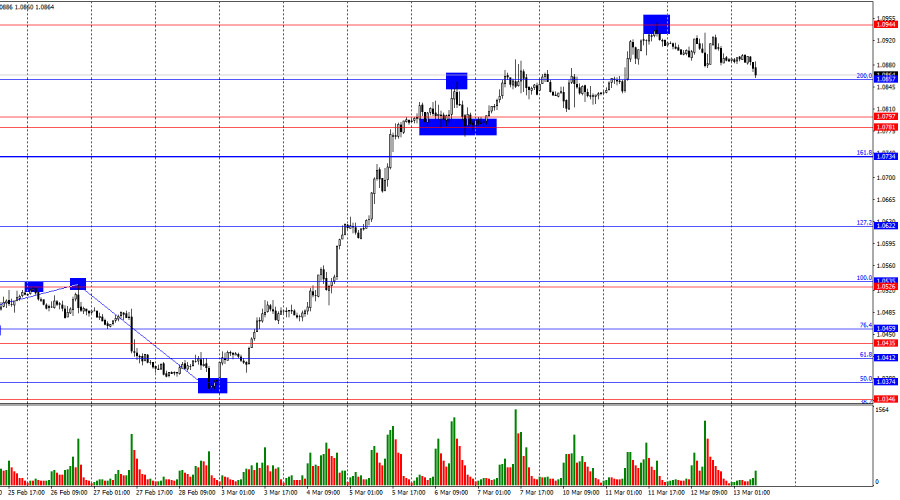
On Wednesday, the EUR/USD pair continued a very weak decline after rebounding from the 1.0944 level. This morning, it reached the 200.0% corrective level at 1.0857. A rebound from this level would favor the euro and a resumption of growth toward 1.0944. A consolidation below 1.0857 would open the way for bears toward the support zone of 1.0781 – 1.0797 and the Fibonacci 161.8% level at 1.0734.

This image is no longer relevant

The wave structure on the hourly chart has transformed. The last completed downward wave broke the previous low, while the new upward wave broke the previous peak. Thus, the current wave pattern suggests a "bullish" trend. At the same time, the ongoing growth is impulsive, driven by bulls attacking due to concerns about a slowdown in the U.S. economy following Donald Trump's policies. This is almost the only reason for the recent collapse of the U.S. dollar.

The information background on Wednesday was interesting for everyone except traders. There were no new statements from Donald Trump regarding his international battle for justice, so traders found no reason to continue selling the dollar and had little desire to trade at all. Even though an important U.S. inflation report was released yesterday, market activity remained very weak throughout the day. The impact of Trump's tariffs on market sentiment seems to be weakening. Last week, we saw an explosive rise in the pair, but this week's growth has been much more modest. The bulls are losing momentum, and the tariff story has already been priced in. I doubt that every new tariff-related news will trigger another powerful surge in buying. The market should return to focusing on economic data, which does not indicate negative changes in the U.S. economy or positive developments in the European economy. I expect a downward wave.

This image is no longer relevant

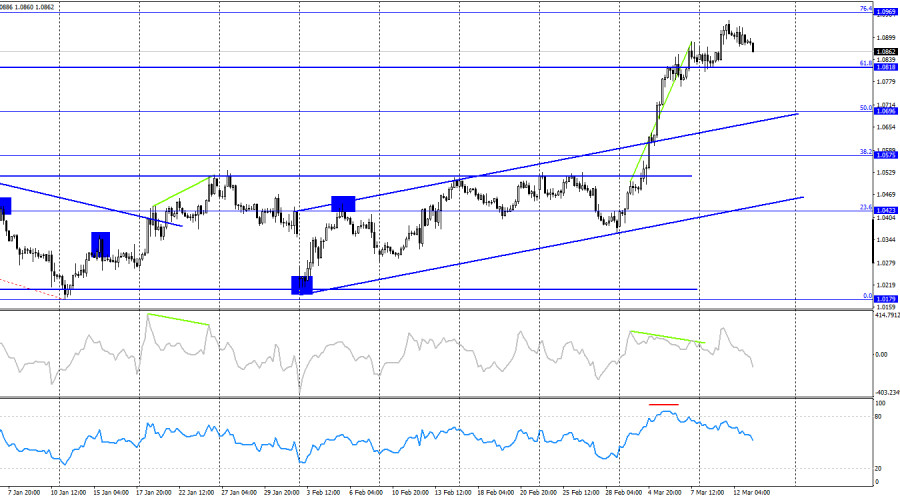
On the 4-hour chart, the pair continues its upward movement after breaking out of the horizontal channel. The trend remains "bullish," as indicated by the upward trend channel. The pair's consolidation above the 61.8% Fibonacci level at 1.0818 suggests further growth toward the next Fibonacci level of 76.4% at 1.0969. The "bearish" divergence on the CCI indicator and the overbought RSI indicator both signal a potential decline, yet the bears are attacking very weakly. A rebound from 1.0969 would indicate a possible decline toward 1.0818 or lower.

Commitments of Traders (COT) Report:

This image is no longer relevant

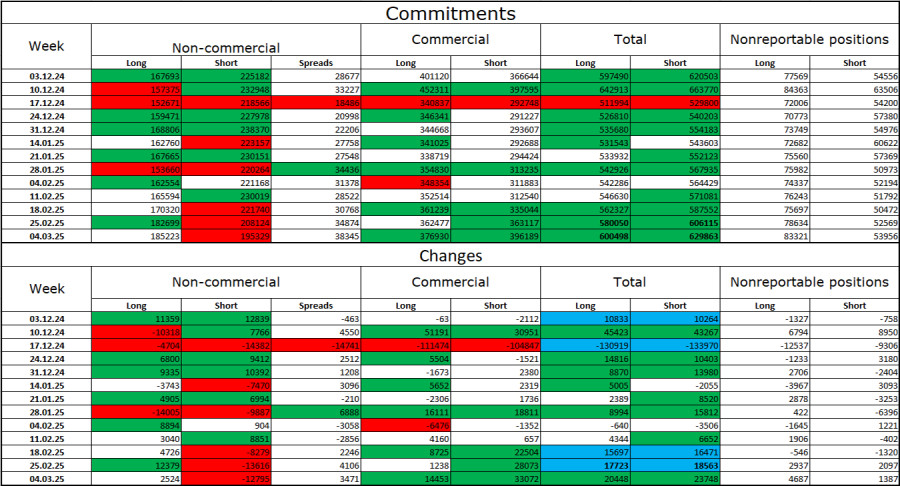
During the last reporting week, professional traders opened 2,524 Long positions and closed 12,795 Short positions. The sentiment of the "Non-commercial" group remains "bearish," but it has been weakening lately. The total number of Long positions held by speculators is now 185,000, while the number of Short positions stands at 195,000.

For twenty consecutive weeks, large players have been reducing their euro holdings, confirming an undisputed "bearish" trend. The divergence in monetary policy approaches between the ECB and the Fed continues to favor the U.S. dollar. While the "bearish" advantage is weakening, it is still too early to declare the trend over. The number of Long positions has been growing for five weeks in a row—coinciding, interestingly, with Donald Trump's presidency.

Economic Calendar for the U.S. and Eurozone:

Eurozone – Industrial Production Change (10:00 UTC). U.S. – Producer Price Index (12:30 UTC). U.S. – Initial Jobless Claims (12:30 UTC).

The economic calendar for March 13 includes three scheduled events, but all are of low significance. Market sentiment on Thursday may see minimal influence from the news flow. The only hope is Donald Trump.

EUR/USD Forecast and Trading Recommendations:

Selling the pair is possible on a rebound from 1.0944 on the hourly chart, with targets at 1.0857 and 1.0797. Alternatively, selling could be considered upon a close below 1.0857, targeting 1.0797 and 1.0734. Buying remains an option, but I am still wary of the strong and uninterrupted rise in the pair. I am cautious when prices move in only one direction.

Fibonacci retracement levels are built between 1.0529 – 1.0213 on the hourly chart and 1.1214 – 1.0179 on the 4-hour chart.

Samir Klishi,
Analytical expert of InstaForex
© 2007-2025
Select timeframe
5
min
15
min
30
min
1
hour
4
hours
1
day
1
week
Earn on cryptocurrency rate changes with InstaForex
Download MetaTrader 4 and open your first trade
  • Grand Choice
    Contest by
    InstaForex
    InstaForex always strives to help you
    fulfill your biggest dreams.
    JOIN CONTEST

Recommended Stories

Forecast for EUR/USD on June 13, 2025

On Thursday, the EUR/USD pair continued its upward movement and consolidated above the 100.0% Fibonacci retracement level at 1.1574. However, during the night, a sharp reversal occurred in favor

Samir Klishi 11:52 2025-06-13 UTC+2

Forecast for GBP/USD on June 13, 2025

On the hourly chart, the GBP/USD pair on Thursday rebounded from the 1.3520 level, surged to the resistance zone of 1.3611–1.3620, bounced off it twice, and then fell back

Samir Klishi 11:49 2025-06-13 UTC+2

EUR/USD. June 12. A Setback for the Dollar

Good day, dear traders! On Wednesday, the EUR/USD pair continued its upward movement after rebounding from the support zone of 1.1374–1.1380. It successfully consolidated above the 76.4% Fibonacci retracement level

Samir Klishi 10:15 2025-06-12 UTC+2

GBP/USD. June 12. British Economy Falters

Good day, dear traders! On the hourly chart, on Wednesday, the GBP/USD pair reversed in favor of the British pound and consolidated above the 161.8% Fibonacci retracement level at 1.3520

Samir Klishi 10:15 2025-06-12 UTC+2

Technical Analysis of Daily Price Movement Crude Oil Commodity Instrument, Thursday June 12, 2025.

If we look at the daily chart of the Crude Oil commodity instrument, there appears to be a Divergence between the price movement of #CL and the Stochastic Oscillator indicator

Arief Makmur 08:10 2025-06-12 UTC+2

Technical Analysis of Intraday Price Movement of Nasdaq 100 Index, Thursday June 12, 2025.

On the 4-hour chart of the Nasdaq 100 index, there is a divergence between its price movement and the Stochastic Oscillator indicator, especially with the current confirmation of the price

Arief Makmur 08:10 2025-06-12 UTC+2

Trading Signals for EUR/USD for June 12-19, 2025: sell below 1.1500 (21 SMA - 8/8 Murray)

If the euro price falls below 1.1500 in the coming hours, this could be seen as an opportunity to sell. Technically, it appears overbought on the H4 chart and could

Dimitrios Zappas 05:33 2025-06-12 UTC+2

Trading Signals for GOLD (XAU/USD) for June 12-19, 2025: sell below $3,386 (21 SMA - 7/8 Murray)

The XAU/USD trend remains bullish as long as the price consolidates above 3,331. Therefore, it would be prudent to buy gold as long as the price consolidates above 3,359, where

Dimitrios Zappas 05:32 2025-06-12 UTC+2

EUR/USD Forecast for June 12, 2025

The U.S. inflation data released on Wednesday stirred the markets: the dollar index dropped by 0.47%, WTI oil surged by 5.54%, gold rose by 1.27%, and 5-year U.S. Treasury yields

Laurie Bailey 04:40 2025-06-12 UTC+2

GBP/USD Forecast for June 12, 2025

On Wednesday, the British pound successfully avoided a decline below technical support levels, reversing upward from them. The price rebounded from the MACD indicator line on the daily chart, while

Laurie Bailey 04:40 2025-06-12 UTC+2
Can't speak right now?
Ask your question in the chat.
Widget callback
 

Dear visitor,

Your IP address shows that you are currently located in the USA. If you are a resident of the United States, you are prohibited from using the services of InstaFintech Group including online trading, online transfers, deposit/withdrawal of funds, etc.

If you think you are seeing this message by mistake and your location is not the US, kindly proceed to the website. Otherwise, you must leave the website in order to comply with government restrictions.

Why does your IP address show your location as the USA?

  • - you are using a VPN provided by a hosting company based in the United States;
  • - your IP does not have proper WHOIS records;
  • - an error occurred in the WHOIS geolocation database.

Please confirm whether you are a US resident or not by clicking the relevant button below. If you choose the wrong option, being a US resident, you will not be able to open an account with InstaForex anyway.

We are sorry for any inconvenience caused by this message.