

signal strength 1 of 5
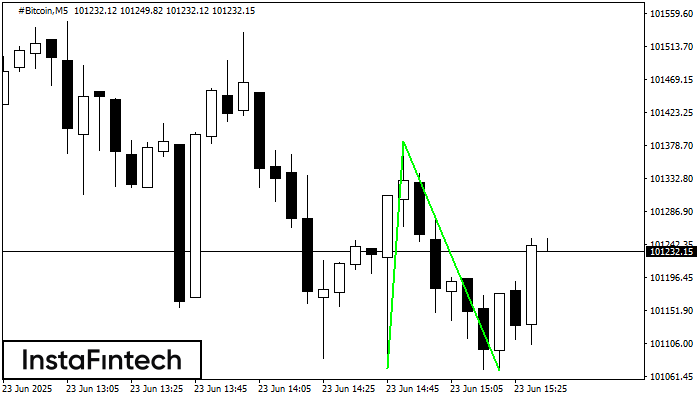
The Double Bottom pattern has been formed on #Bitcoin M5. This formation signals a reversal of the trend from downwards to upwards. The signal is that a buy trade should be opened after the upper boundary of the pattern 101384.08 is broken. The further movements will rely on the width of the current pattern 31179 points.
The M5 and M15 time frames may have more false entry points.
See Also
- All
- Double Top
- Flag
- Head and Shoulders
- Pennant
- Rectangle
- Triangle
- Triple top
- All
- #AAPL
- #AMZN
- #Bitcoin
- #EBAY
- #FB
- #GOOG
- #INTC
- #KO
- #MA
- #MCD
- #MSFT
- #NTDOY
- #PEP
- #TSLA
- #TWTR
- AUDCAD
- AUDCHF
- AUDJPY
- AUDUSD
- EURCAD
- EURCHF
- EURGBP
- EURJPY
- EURNZD
- EURRUB
- EURUSD
- GBPAUD
- GBPCHF
- GBPJPY
- GBPUSD
- GOLD
- NZDCAD
- NZDCHF
- NZDJPY
- NZDUSD
- SILVER
- USDCAD
- USDCHF
- USDJPY
- USDRUB
- All
- M5
- M15
- M30
- H1
- D1
- All
- Buy
- Sale
- All
- 1
- 2
- 3
- 4
- 5
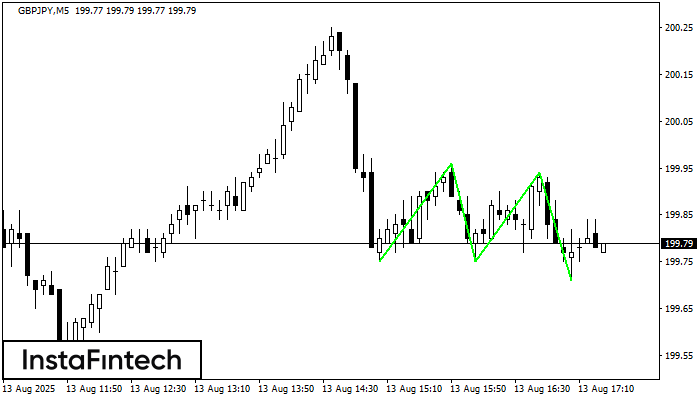
The Triple Bottom pattern has formed on the chart of GBPJPY M5. Features of the pattern: The lower line of the pattern has coordinates 199.96 with the upper limit 199.96/199.94
The M5 and M15 time frames may have more false entry points.
Open chart in a new window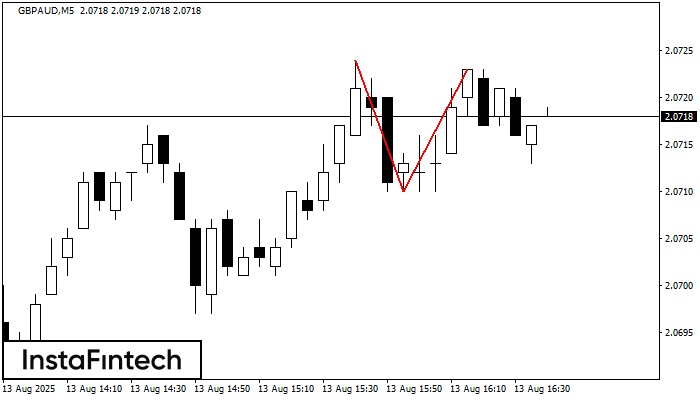
The Double Top reversal pattern has been formed on GBPAUD M5. Characteristics: the upper boundary 2.0724; the lower boundary 2.0710; the width of the pattern is 13 points. Sell trades
The M5 and M15 time frames may have more false entry points.
Open chart in a new window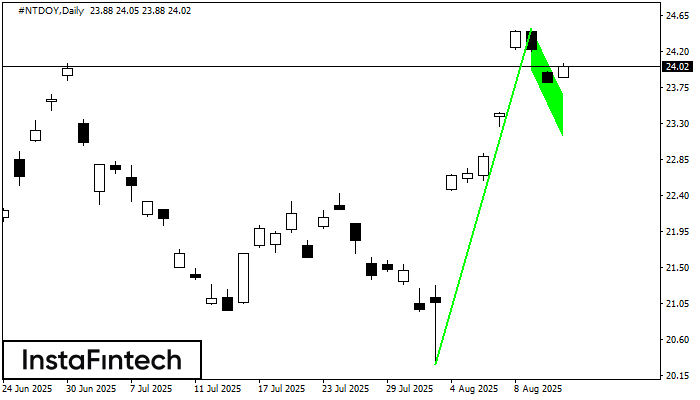
The Bullish Flag pattern which signals continuation of a trend has been formed on the chart #NTDOY D1. Forecast: if the price breaks above the pattern high at 24.49, then
Open chart in a new window


