


signal strength 1 of 5

The Bearish pennant pattern has formed on the #AMZN M5 chart. It signals potential continuation of the existing trend. Specifications: the pattern’s bottom has the coordinate of 184.25; the projection of the flagpole height is equal to 866 pips. In case the price breaks out the pattern’s bottom of 184.25, the downtrend is expected to continue for further level 184.10.
The M5 and M15 time frames may have more false entry points.
See Also
- All
- Double Top
- Flag
- Head and Shoulders
- Pennant
- Rectangle
- Triangle
- Triple top
- All
- #AAPL
- #AMZN
- #Bitcoin
- #EBAY
- #FB
- #GOOG
- #INTC
- #KO
- #MA
- #MCD
- #MSFT
- #NTDOY
- #PEP
- #TSLA
- #TWTR
- AUDCAD
- AUDCHF
- AUDJPY
- AUDUSD
- EURCAD
- EURCHF
- EURGBP
- EURJPY
- EURNZD
- EURRUB
- EURUSD
- GBPAUD
- GBPCHF
- GBPJPY
- GBPUSD
- GOLD
- NZDCAD
- NZDCHF
- NZDJPY
- NZDUSD
- SILVER
- USDCAD
- USDCHF
- USDJPY
- USDRUB
- All
- M5
- M15
- M30
- H1
- D1
- All
- Buy
- Sale
- All
- 1
- 2
- 3
- 4
- 5
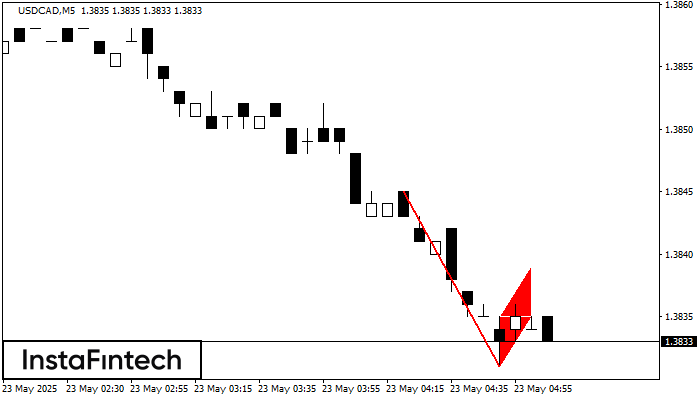
The Bearish Flag pattern has been formed on the chart USDCAD M5 which signals that the downward trend will continue. If the price breaks below the low at 1.3831, then
The M5 and M15 time frames may have more false entry points.
Open chart in a new window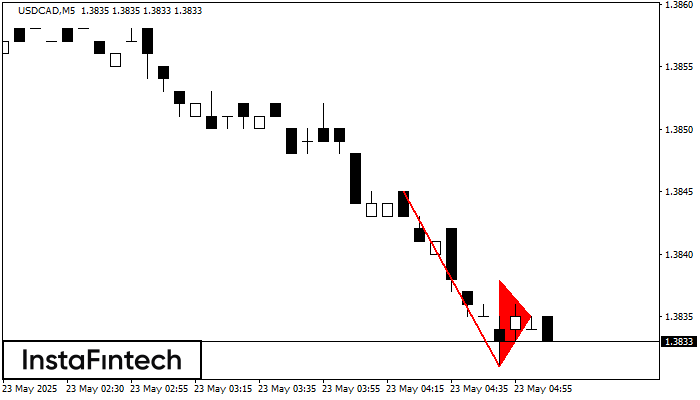
The Bearish pennant pattern has formed on the USDCAD M5 chart. This pattern type is characterized by a slight slowdown after which the price will move in the direction
The M5 and M15 time frames may have more false entry points.
Open chart in a new window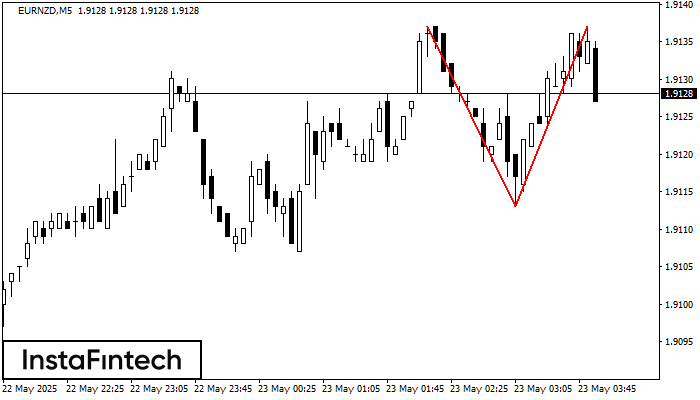
The Double Top pattern has been formed on EURNZD M5. It signals that the trend has been changed from upwards to downwards. Probably, if the base of the pattern 1.9113
The M5 and M15 time frames may have more false entry points.
Open chart in a new window


