


signal strength 2 of 5
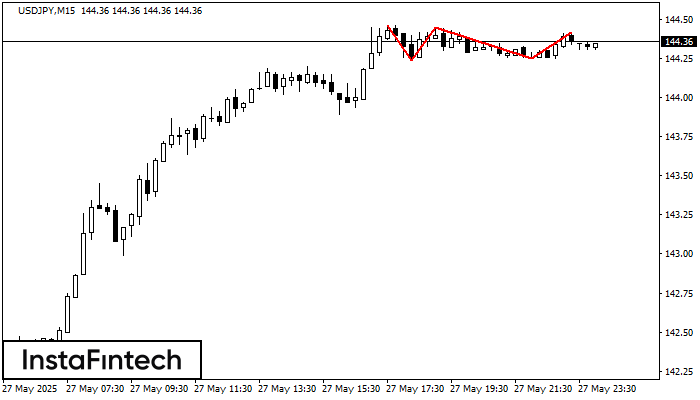
The Triple Top pattern has formed on the chart of the USDJPY M15 trading instrument. It is a reversal pattern featuring the following characteristics: resistance level 4, support level -1, and pattern’s width 22. Forecast If the price breaks through the support level 144.24, it is likely to move further down to 144.23.
The M5 and M15 time frames may have more false entry points.
- All
- Double Top
- Flag
- Head and Shoulders
- Pennant
- Rectangle
- Triangle
- Triple top
- All
- #AAPL
- #AMZN
- #Bitcoin
- #EBAY
- #FB
- #GOOG
- #INTC
- #KO
- #MA
- #MCD
- #MSFT
- #NTDOY
- #PEP
- #TSLA
- #TWTR
- AUDCAD
- AUDCHF
- AUDJPY
- AUDUSD
- EURCAD
- EURCHF
- EURGBP
- EURJPY
- EURNZD
- EURRUB
- EURUSD
- GBPAUD
- GBPCHF
- GBPJPY
- GBPUSD
- GOLD
- NZDCAD
- NZDCHF
- NZDJPY
- NZDUSD
- SILVER
- USDCAD
- USDCHF
- USDJPY
- USDRUB
- All
- M5
- M15
- M30
- H1
- D1
- All
- Buy
- Sale
- All
- 1
- 2
- 3
- 4
- 5
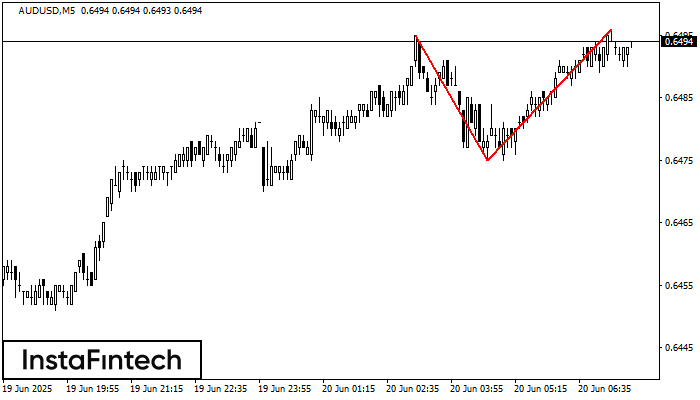
On the chart of AUDUSD M5 the Double Top reversal pattern has been formed. Characteristics: the upper boundary 0.6496; the lower boundary 0.6475; the width of the pattern 21 points
The M5 and M15 time frames may have more false entry points.
Open chart in a new window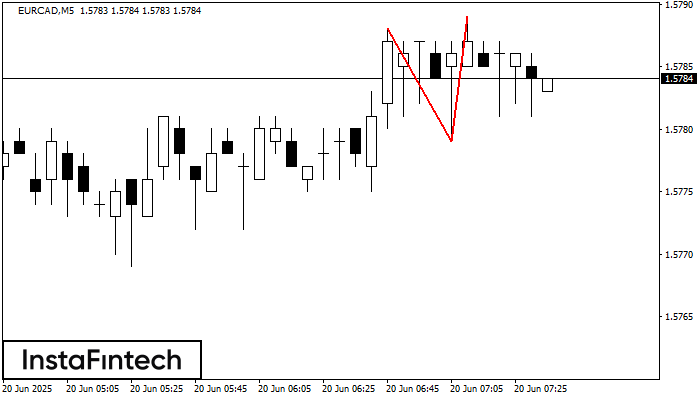
The Double Top reversal pattern has been formed on EURCAD M5. Characteristics: the upper boundary 1.5788; the lower boundary 1.5779; the width of the pattern is 10 points. Sell trades
The M5 and M15 time frames may have more false entry points.
Open chart in a new window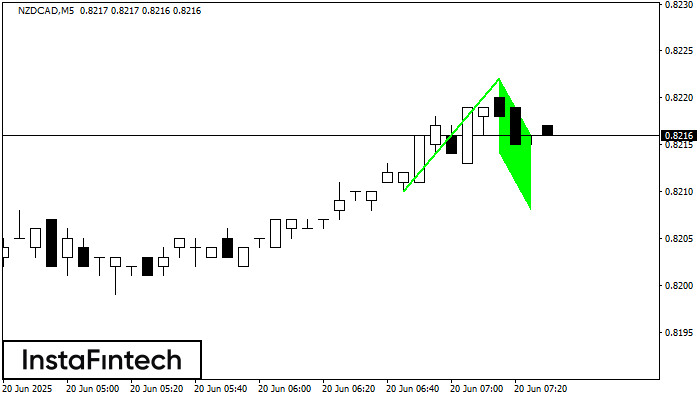
The Bullish Flag pattern has been formed on the chart NZDCAD M5 which signals that the upward trend will continue. Signals: а break of the peak at 0.8222 may push
The M5 and M15 time frames may have more false entry points.
Open chart in a new window


