signal strength 1 of 5
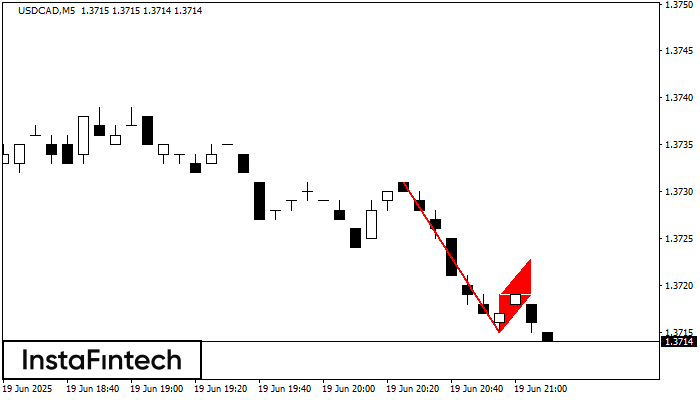
The Bearish Flag pattern has been formed on USDCAD at M5. The lower boundary of the pattern is located at 1.3715/1.3719 while the upper boundary lies at 1.3719/1.3723. The projection of the flagpole is 16 points. This formation signals that the downward trend is most likely to continue. Therefore, if the level of 1.3715 is broken, the price will move further downwards.
The M5 and M15 time frames may have more false entry points.
See Also
- All
- Double Top
- Flag
- Head and Shoulders
- Pennant
- Rectangle
- Triangle
- Triple top
- All
- #AAPL
- #AMZN
- #Bitcoin
- #EBAY
- #FB
- #GOOG
- #INTC
- #KO
- #MA
- #MCD
- #MSFT
- #NTDOY
- #PEP
- #TSLA
- #TWTR
- AUDCAD
- AUDCHF
- AUDJPY
- AUDUSD
- EURCAD
- EURCHF
- EURGBP
- EURJPY
- EURNZD
- EURRUB
- EURUSD
- GBPAUD
- GBPCHF
- GBPJPY
- GBPUSD
- GOLD
- NZDCAD
- NZDCHF
- NZDJPY
- NZDUSD
- SILVER
- USDCAD
- USDCHF
- USDJPY
- USDRUB
- All
- M5
- M15
- M30
- H1
- D1
- All
- Buy
- Sale
- All
- 1
- 2
- 3
- 4
- 5
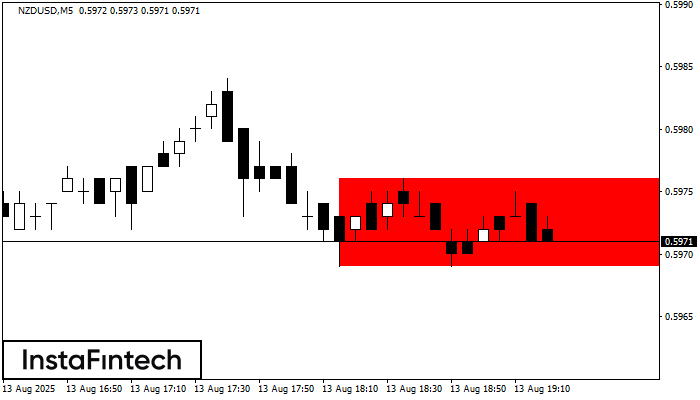
According to the chart of M5, NZDUSD formed the Bearish Rectangle. The pattern indicates a trend continuation. The upper border is 0.5976, the lower border is 0.5969. The signal means
The M5 and M15 time frames may have more false entry points.
Open chart in a new window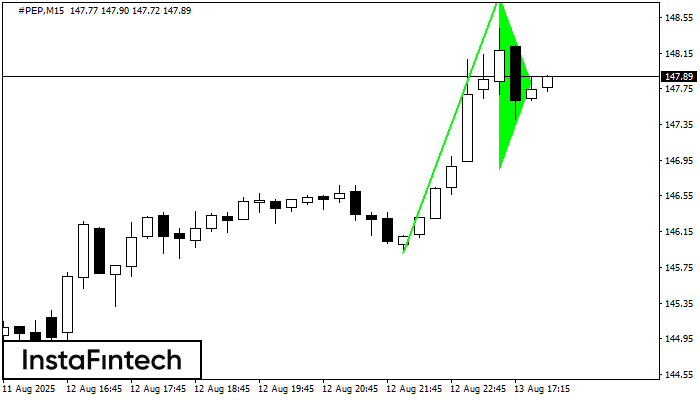
The Bullish pennant signal – Trading instrument #PEP M15, continuation pattern. Forecast: it is possible to set up a buy position above the pattern’s high of 148.79, with the prospect
The M5 and M15 time frames may have more false entry points.
Open chart in a new window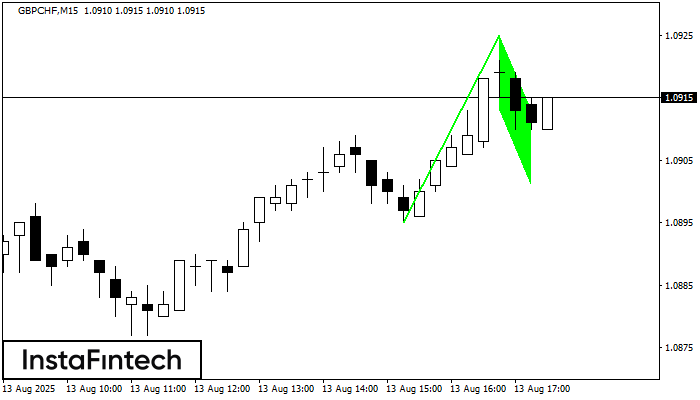
The Bullish Flag pattern which signals continuation of a trend has been formed on the chart GBPCHF M15. Forecast: if the price breaks above the pattern high at 1.0925, then
The M5 and M15 time frames may have more false entry points.
Open chart in a new window