


signal strength 3 of 5
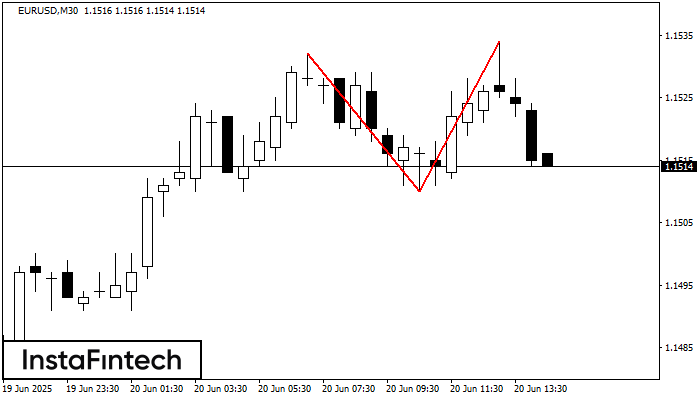
The Double Top pattern has been formed on EURUSD M30. It signals that the trend has been changed from upwards to downwards. Probably, if the base of the pattern 1.1510 is broken, the downward movement will continue.
See Also
- All
- Double Top
- Flag
- Head and Shoulders
- Pennant
- Rectangle
- Triangle
- Triple top
- All
- #AAPL
- #AMZN
- #Bitcoin
- #EBAY
- #FB
- #GOOG
- #INTC
- #KO
- #MA
- #MCD
- #MSFT
- #NTDOY
- #PEP
- #TSLA
- #TWTR
- AUDCAD
- AUDCHF
- AUDJPY
- AUDUSD
- EURCAD
- EURCHF
- EURGBP
- EURJPY
- EURNZD
- EURRUB
- EURUSD
- GBPAUD
- GBPCHF
- GBPJPY
- GBPUSD
- GOLD
- NZDCAD
- NZDCHF
- NZDJPY
- NZDUSD
- SILVER
- USDCAD
- USDCHF
- USDJPY
- USDRUB
- All
- M5
- M15
- M30
- H1
- D1
- All
- Buy
- Sale
- All
- 1
- 2
- 3
- 4
- 5
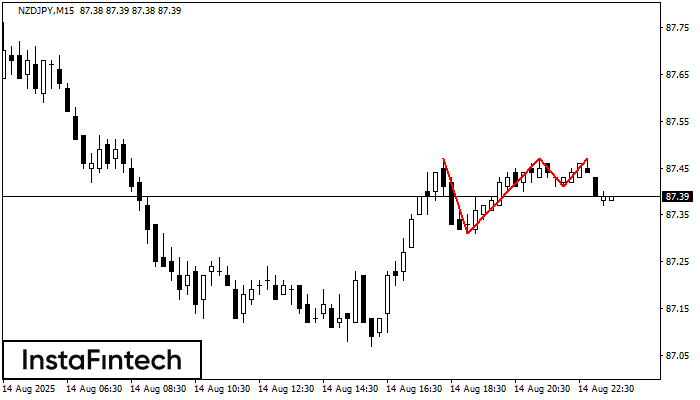
The Triple Top pattern has formed on the chart of the NZDJPY M15. Features of the pattern: borders have an ascending angle; the lower line of the pattern
The M5 and M15 time frames may have more false entry points.
Open chart in a new window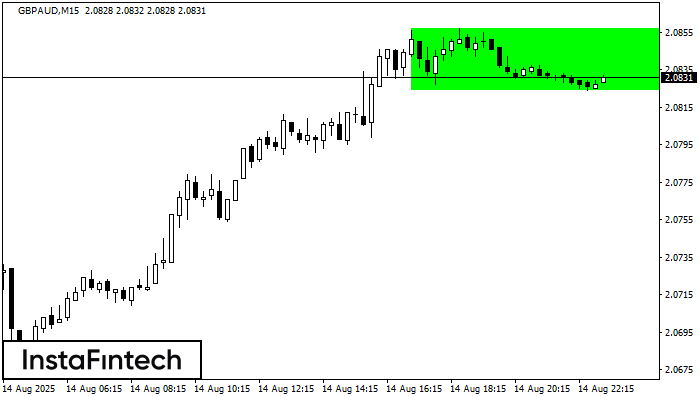
According to the chart of M15, GBPAUD formed the Bullish Rectangle. This type of a pattern indicates a trend continuation. It consists of two levels: resistance 2.0857 and support 2.0824
The M5 and M15 time frames may have more false entry points.
Open chart in a new window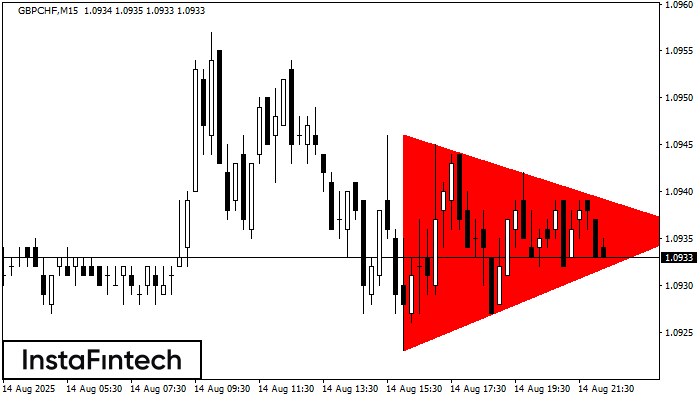
According to the chart of M15, GBPCHF formed the Bearish Symmetrical Triangle pattern. Description: The lower border is 1.0923/1.0936 and upper border is 1.0946/1.0936. The pattern width is measured
The M5 and M15 time frames may have more false entry points.
Open chart in a new window


