

signal strength 2 of 5
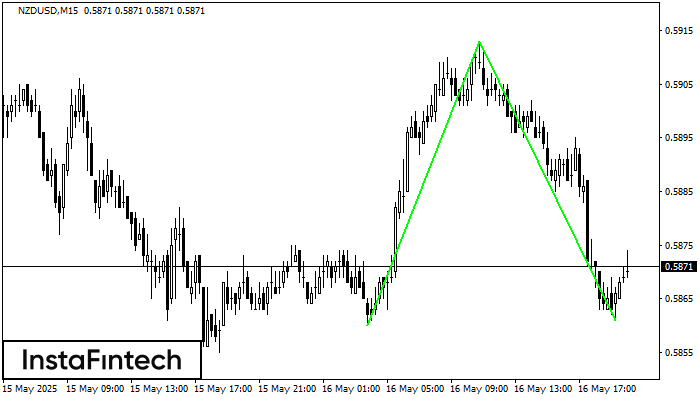
The Double Bottom pattern has been formed on NZDUSD M15. Characteristics: the support level 0.5860; the resistance level 0.5913; the width of the pattern 53 points. If the resistance level is broken, a change in the trend can be predicted with the first target point lying at the distance of 52 points.
The M5 and M15 time frames may have more false entry points.
See Also
- All
- Double Top
- Flag
- Head and Shoulders
- Pennant
- Rectangle
- Triangle
- Triple top
- All
- #AAPL
- #AMZN
- #Bitcoin
- #EBAY
- #FB
- #GOOG
- #INTC
- #KO
- #MA
- #MCD
- #MSFT
- #NTDOY
- #PEP
- #TSLA
- #TWTR
- AUDCAD
- AUDCHF
- AUDJPY
- AUDUSD
- EURCAD
- EURCHF
- EURGBP
- EURJPY
- EURNZD
- EURRUB
- EURUSD
- GBPAUD
- GBPCHF
- GBPJPY
- GBPUSD
- GOLD
- NZDCAD
- NZDCHF
- NZDJPY
- NZDUSD
- SILVER
- USDCAD
- USDCHF
- USDJPY
- USDRUB
- All
- M5
- M15
- M30
- H1
- D1
- All
- Buy
- Sale
- All
- 1
- 2
- 3
- 4
- 5
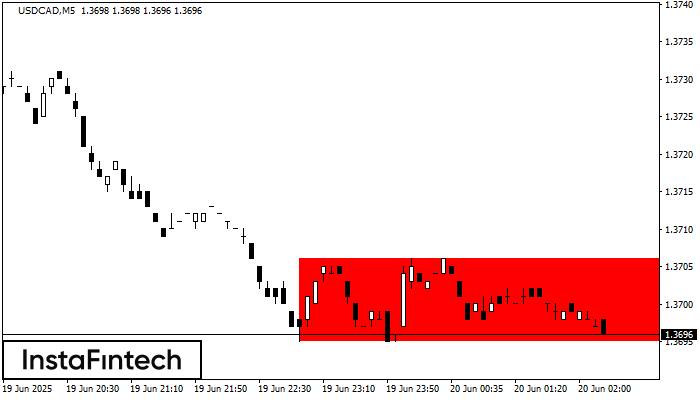
Según el gráfico de M5, USDCAD formó el Rectángulo Bajista que es un patrón de la continuación de una tendencia. El patrón está contenido dentro de los siguientes límites: límite
Los marcos de tiempo M5 y M15 pueden tener más puntos de entrada falsos.
Open chart in a new window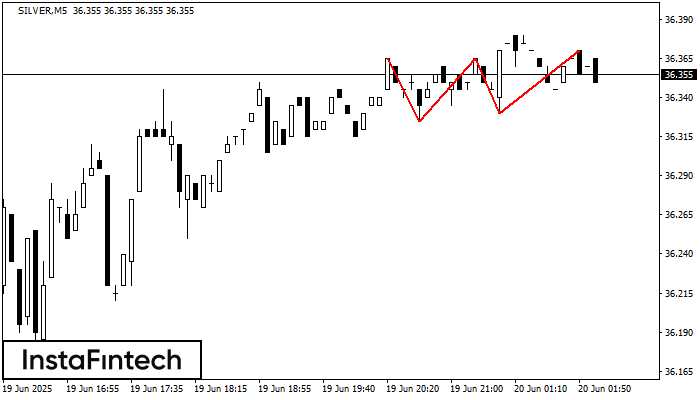
El patrón Triple Techo ha sido formado en el gráfico del instrumento de negociación SILVER M5. Este es un patrón de reversión que presenta las siguientes características: nivel de resistencia
Los marcos de tiempo M5 y M15 pueden tener más puntos de entrada falsos.
Open chart in a new window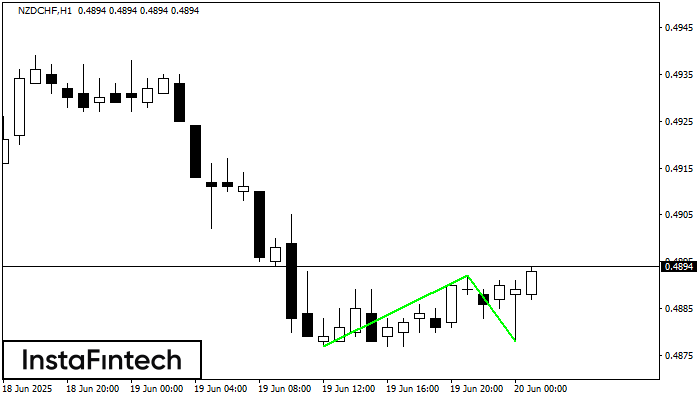
El patrón Doble Piso ha sido formado en NZDCHF H1. Características: el nivel de soporte 0.4877; el nivel de resistencia 0.4892; el ancho del patrón 15 puntos. Si el nivel
Open chart in a new window


