signal strength 4 of 5
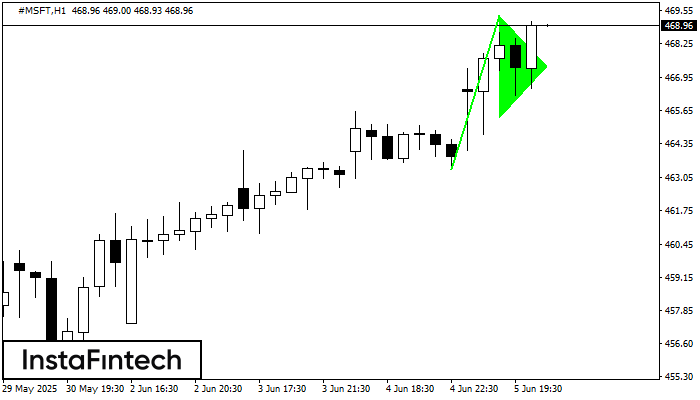
The Bullish pennant pattern is formed on the #MSFT H1 chart. It is a type of the continuation pattern. Supposedly, in case the price is fixed above the pennant’s high of 469.34, a further uptrend is possible.
See Also
- All
- Double Top
- Flag
- Head and Shoulders
- Pennant
- Rectangle
- Triangle
- Triple top
- All
- #AAPL
- #AMZN
- #Bitcoin
- #EBAY
- #FB
- #GOOG
- #INTC
- #KO
- #MA
- #MCD
- #MSFT
- #NTDOY
- #PEP
- #TSLA
- #TWTR
- AUDCAD
- AUDCHF
- AUDJPY
- AUDUSD
- EURCAD
- EURCHF
- EURGBP
- EURJPY
- EURNZD
- EURRUB
- EURUSD
- GBPAUD
- GBPCHF
- GBPJPY
- GBPUSD
- GOLD
- NZDCAD
- NZDCHF
- NZDJPY
- NZDUSD
- SILVER
- USDCAD
- USDCHF
- USDJPY
- USDRUB
- All
- M5
- M15
- M30
- H1
- D1
- All
- Buy
- Sale
- All
- 1
- 2
- 3
- 4
- 5
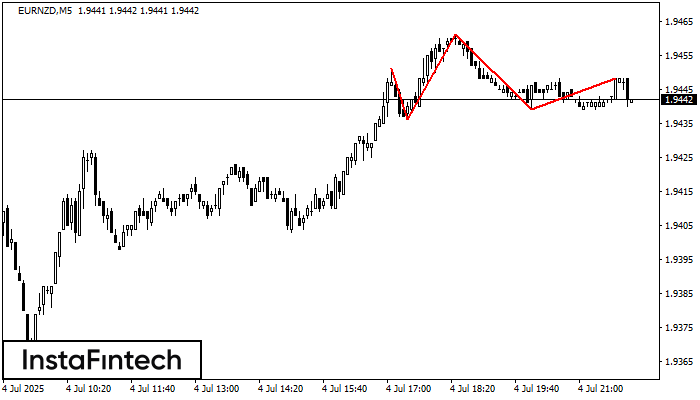
According to the chart of M5, EURNZD formed the Head and Shoulders pattern. The Head’s top is set at 1.9461 while the median line of the Neck is found
The M5 and M15 time frames may have more false entry points.
Open chart in a new window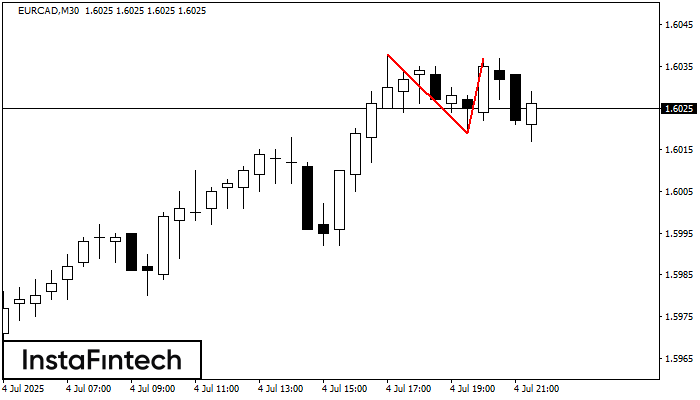
The Double Top pattern has been formed on EURCAD M30. It signals that the trend has been changed from upwards to downwards. Probably, if the base of the pattern 1.6019
Open chart in a new window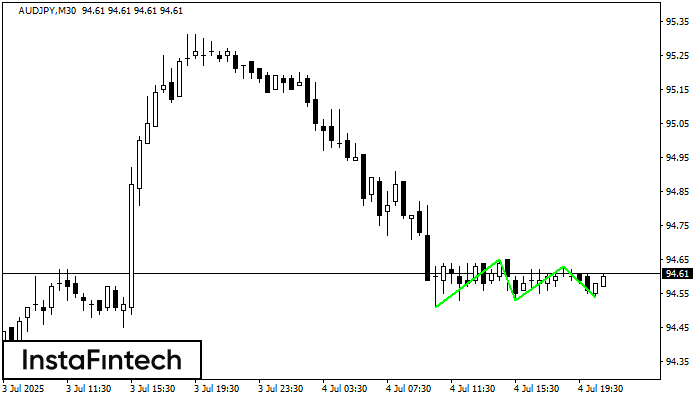
The Triple Bottom pattern has formed on the chart of AUDJPY M30. Features of the pattern: The lower line of the pattern has coordinates 94.65 with the upper limit 94.65/94.63
Open chart in a new window