

signal strength 4 of 5
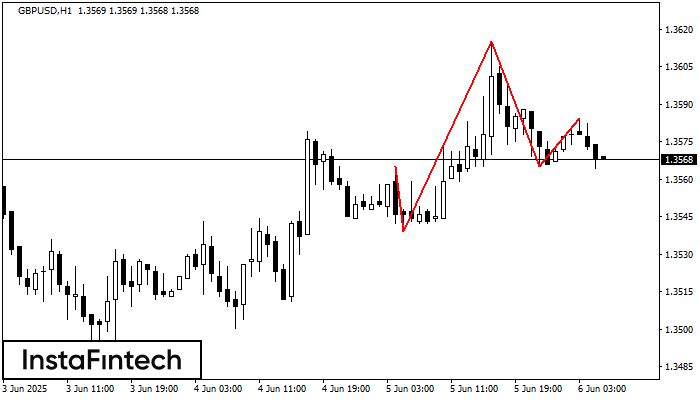
The technical pattern called Head and Shoulders has appeared on the chart of GBPUSD H1. There are weighty reasons to suggest that the price will surpass the Neckline 1.3539/1.3565 after the right shoulder has been formed. So, the trend is set to change with the price heading for 1.3525.
- All
- Double Top
- Flag
- Head and Shoulders
- Pennant
- Rectangle
- Triangle
- Triple top
- All
- #AAPL
- #AMZN
- #Bitcoin
- #EBAY
- #FB
- #GOOG
- #INTC
- #KO
- #MA
- #MCD
- #MSFT
- #NTDOY
- #PEP
- #TSLA
- #TWTR
- AUDCAD
- AUDCHF
- AUDJPY
- AUDUSD
- EURCAD
- EURCHF
- EURGBP
- EURJPY
- EURNZD
- EURRUB
- EURUSD
- GBPAUD
- GBPCHF
- GBPJPY
- GBPUSD
- GOLD
- NZDCAD
- NZDCHF
- NZDJPY
- NZDUSD
- SILVER
- USDCAD
- USDCHF
- USDJPY
- USDRUB
- All
- M5
- M15
- M30
- H1
- D1
- All
- Buy
- Sale
- All
- 1
- 2
- 3
- 4
- 5
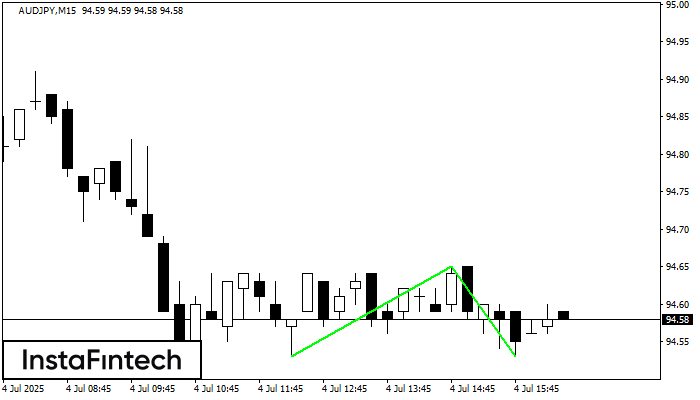
El patrón Doble Piso ha sido formado en AUDJPY M15. Características: el nivel de soporte 94.53; el nivel de resistencia 94.65; el ancho del patrón 12 puntos. Si el nivel
Los marcos de tiempo M5 y M15 pueden tener más puntos de entrada falsos.
Open chart in a new window
Según el gráfico de M5, el NZDCAD formó el patrón Triángulo Simétrico Alcista. El límite inferior del patrón toca las coordenadas 0.8227/0.8235 donde el límite superior cruza 0.8246/0.8235
Los marcos de tiempo M5 y M15 pueden tener más puntos de entrada falsos.
Open chart in a new window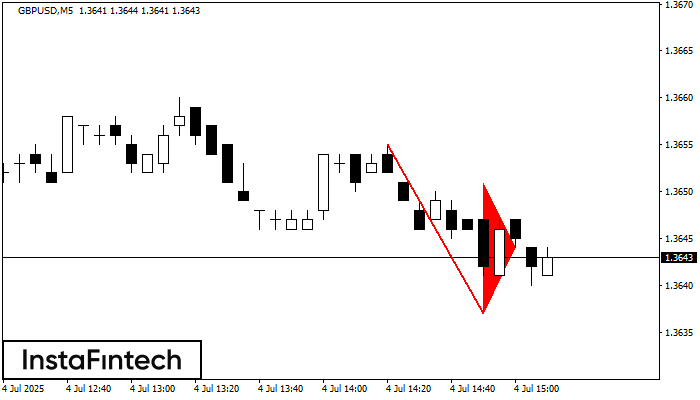
El patrón Banderín bajista se ha formado en el gráfico GBPUSD M5. Este tipo de patrón se caracteriza por una ligera disminución después de lo cual el precio se moverá
Los marcos de tiempo M5 y M15 pueden tener más puntos de entrada falsos.
Open chart in a new window


