

signal strength 4 of 5
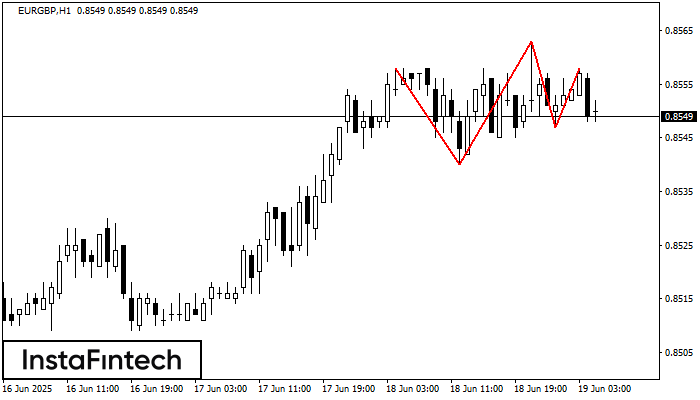
The Triple Top pattern has formed on the chart of the EURGBP H1. Features of the pattern: borders have an ascending angle; the lower line of the pattern has the coordinates 0.8540/0.8547 with the upper limit 0.8558/0.8558; the projection of the width is 18 points. The formation of the Triple Top figure most likely indicates a change in the trend from upward to downward. This means that in the event of a breakdown of the support level of 0.8540, the price is most likely to continue the downward movement.
See Also
- All
- Double Top
- Flag
- Head and Shoulders
- Pennant
- Rectangle
- Triangle
- Triple top
- All
- #AAPL
- #AMZN
- #Bitcoin
- #EBAY
- #FB
- #GOOG
- #INTC
- #KO
- #MA
- #MCD
- #MSFT
- #NTDOY
- #PEP
- #TSLA
- #TWTR
- AUDCAD
- AUDCHF
- AUDJPY
- AUDUSD
- EURCAD
- EURCHF
- EURGBP
- EURJPY
- EURNZD
- EURRUB
- EURUSD
- GBPAUD
- GBPCHF
- GBPJPY
- GBPUSD
- GOLD
- NZDCAD
- NZDCHF
- NZDJPY
- NZDUSD
- SILVER
- USDCAD
- USDCHF
- USDJPY
- USDRUB
- All
- M5
- M15
- M30
- H1
- D1
- All
- Buy
- Sale
- All
- 1
- 2
- 3
- 4
- 5
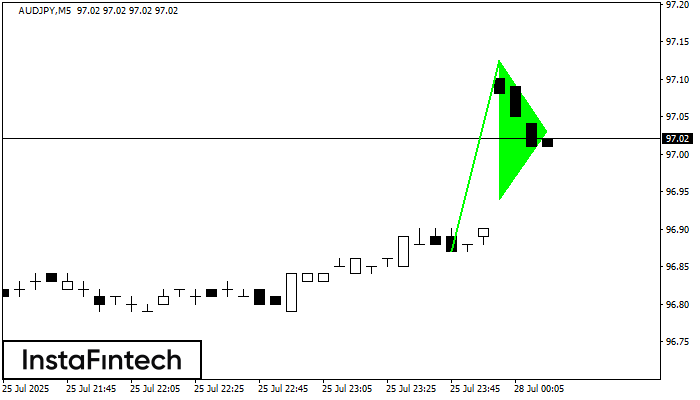
La señal Banderín alcista – Instrumento de negociación AUDJPY M5, patrón de continuación. Pronóstico: es posible establecer una posición de compra por encima del alza del patrón de 97.13
Los marcos de tiempo M5 y M15 pueden tener más puntos de entrada falsos.
Open chart in a new window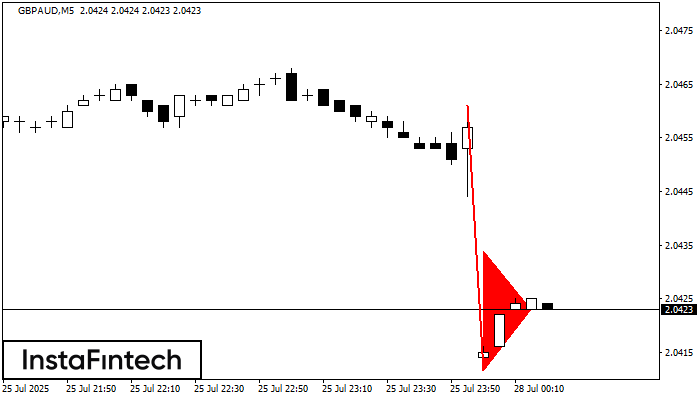
El patrón Banderín bajista se ha formado en el gráfico GBPAUD M5. El patrón señala la continuación de la tendencia bajista en caso de que se rompa el mínimo
Los marcos de tiempo M5 y M15 pueden tener más puntos de entrada falsos.
Open chart in a new window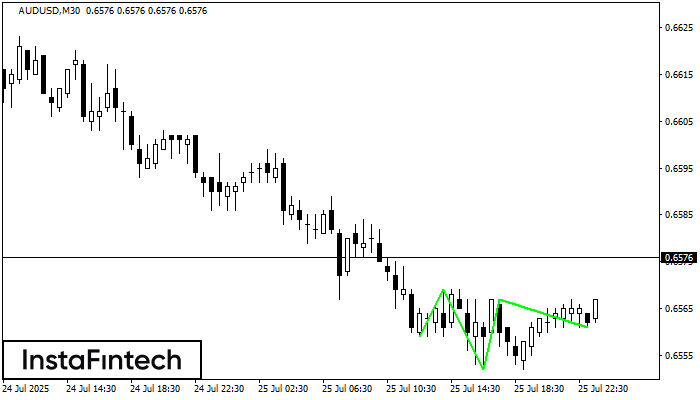
Según M30, AUDUSD está formando el patrón técnico: el Cabeza y Hombros Inverso. En caso de que la línea de cuello 0.6569/0.6567 se rompa, es posible que el instrumento
Open chart in a new window


