signal strength 1 of 5
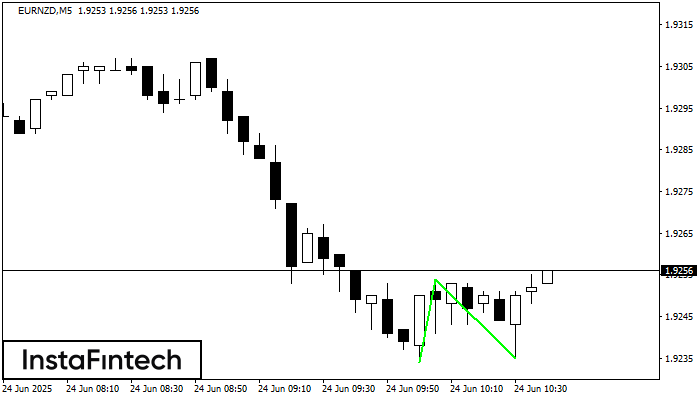
The Double Bottom pattern has been formed on EURNZD M5. This formation signals a reversal of the trend from downwards to upwards. The signal is that a buy trade should be opened after the upper boundary of the pattern 1.9254 is broken. The further movements will rely on the width of the current pattern 20 points.
The M5 and M15 time frames may have more false entry points.
See Also
- All
- Double Top
- Flag
- Head and Shoulders
- Pennant
- Rectangle
- Triangle
- Triple top
- All
- #AAPL
- #AMZN
- #Bitcoin
- #EBAY
- #FB
- #GOOG
- #INTC
- #KO
- #MA
- #MCD
- #MSFT
- #NTDOY
- #PEP
- #TSLA
- #TWTR
- AUDCAD
- AUDCHF
- AUDJPY
- AUDUSD
- EURCAD
- EURCHF
- EURGBP
- EURJPY
- EURNZD
- EURRUB
- EURUSD
- GBPAUD
- GBPCHF
- GBPJPY
- GBPUSD
- GOLD
- NZDCAD
- NZDCHF
- NZDJPY
- NZDUSD
- SILVER
- USDCAD
- USDCHF
- USDJPY
- USDRUB
- All
- M5
- M15
- M30
- H1
- D1
- All
- Buy
- Sale
- All
- 1
- 2
- 3
- 4
- 5
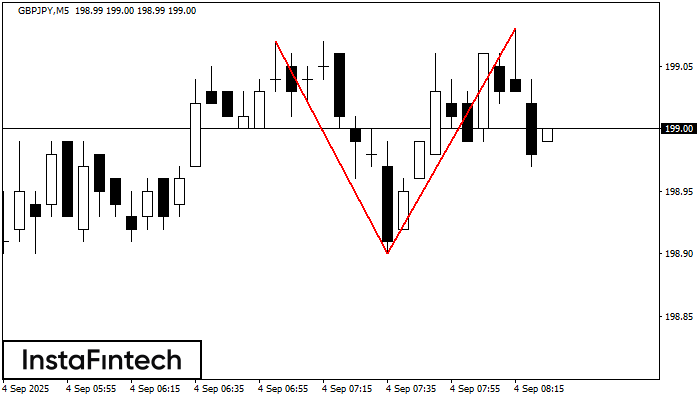
The Double Top pattern has been formed on GBPJPY M5. It signals that the trend has been changed from upwards to downwards. Probably, if the base of the pattern 198.90
The M5 and M15 time frames may have more false entry points.
Open chart in a new window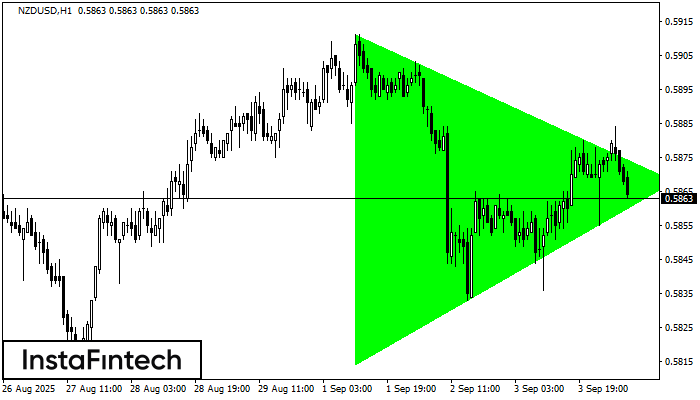
According to the chart of H1, NZDUSD formed the Bullish Symmetrical Triangle pattern. The lower border of the pattern touches the coordinates 0.5814/0.5868 whereas the upper border goes across 0.5911/0.5868
Open chart in a new window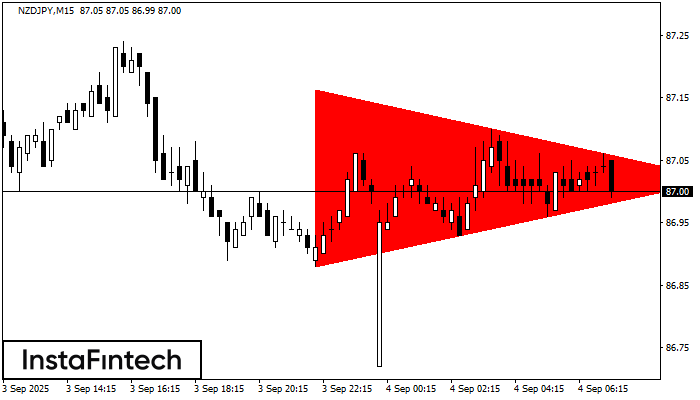
According to the chart of M15, NZDJPY formed the Bearish Symmetrical Triangle pattern. Description: The lower border is 86.88/87.02 and upper border is 87.16/87.02. The pattern width is measured
The M5 and M15 time frames may have more false entry points.
Open chart in a new window