Minor (H4)
What is the first month of winter preparing for us on "raw" instruments? Here's a comprehensive analysis of the development options for the movement AUD / USD vs USD / CAD vs NZD / USD vs #USDX from November 27, 2019 on the Minor operational scale (daily timeframe).
____________________
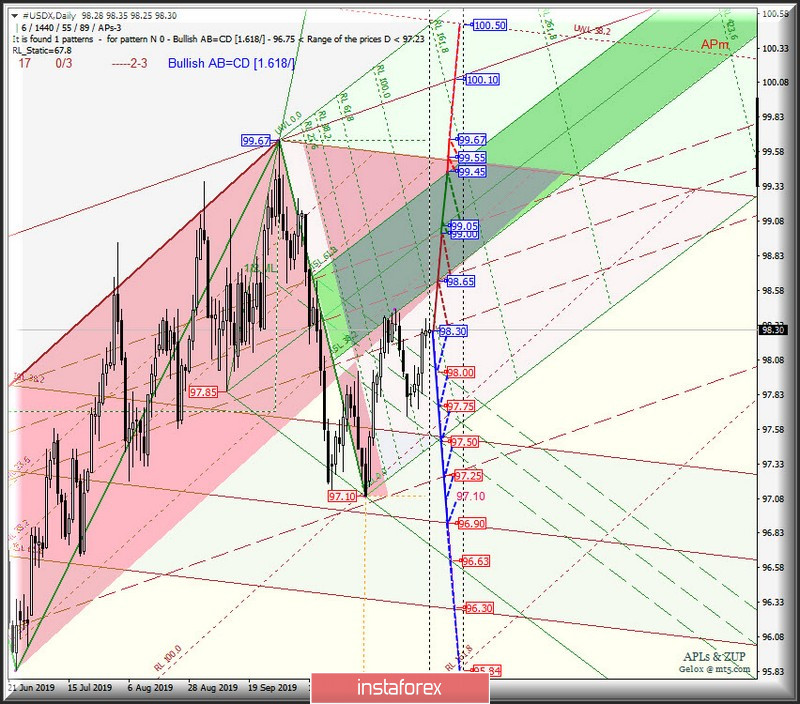
US dollar Index
The dollar index is in the 1/2 Median Line channel of the Minor operational scale forks, therefore, the further development of the #USDX movement from November 27, 2019 will become determined by the development and direction of the breakdown of the boundaries (98.30 - 98.65 - 99.00 ) of the mentioned channel/
A combined breakdown of the upper boundary of the 1/2 Median Line channel (resistance level of 99.00) of the Minor operational scale forks and the 1/2 Median Line Minute (99.05) will make it relevant for the dollar index to reach the upper boundary ISL61.8 (99.45) of the equilibrium zone of the Minuette operational scale forks, the initial line SSL Minor (99.55) and maximum (99.67).
On the other hand, the breakdown of support level 98.30 on the lower boundary of the channel 1/2 Median Line Minor will determine the movement#USDX to the boundaries of the 1/2 Median Line channel (98.00 - 97.75 - 97.50) of the Minuette operational scale forks and the equilibrium zone (97.50 - 96.90 - 96.30) of the Minor operational scale forks.
The markup of #USDX movement options from November 27, 2019 is shown on the animated chart.
____________________
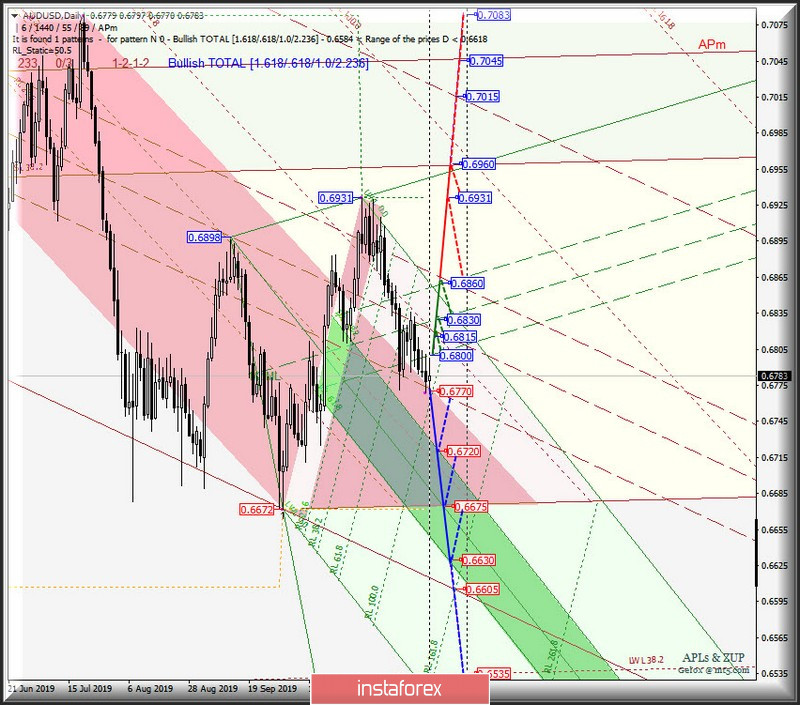
Australian dollar vs US dollar
The movement of the Australian dollar AUD / USD from November 27, 2019 will depend on the direction of the breakdown of the range :
- resistance level of 0.6800 (the lower boundary of the 1/2 Median Line channel of the Minuette operational scale forks);
- support level of 0.6770 (the lower boundary of the 1/2 Median Line channel of the Minor operational scale forks).
The breakdown of the lower boundary of the 1/2 Median Line channel of the Minor operational scale forks - support level of 0.6770 - continue the downward movement of the Australian dollar to the equilibrium zone (0.6720 - 0.6675 - 0.6630) of the Minuette operational scale forks.
Alternatively, the breakdown of the resistance level of 0.6800 will determine the development of the AUD / USD movement in the 1/2 Median Line channel (0.6800 - 0.6830 - 0.6860) of the Minuette operational scale forks, and if the upper boundary (0.6860) of this channel is broken, the upward movement of this currency instrument will continue to the local maximum 0.6931 and the lower boundary of ISL38.2 (0.6960) equilibrium zone of the Minor operational scale forks.
From November 27, 2019, we look at the layout of the AUD / USD movement options on the animated chart.
____________________
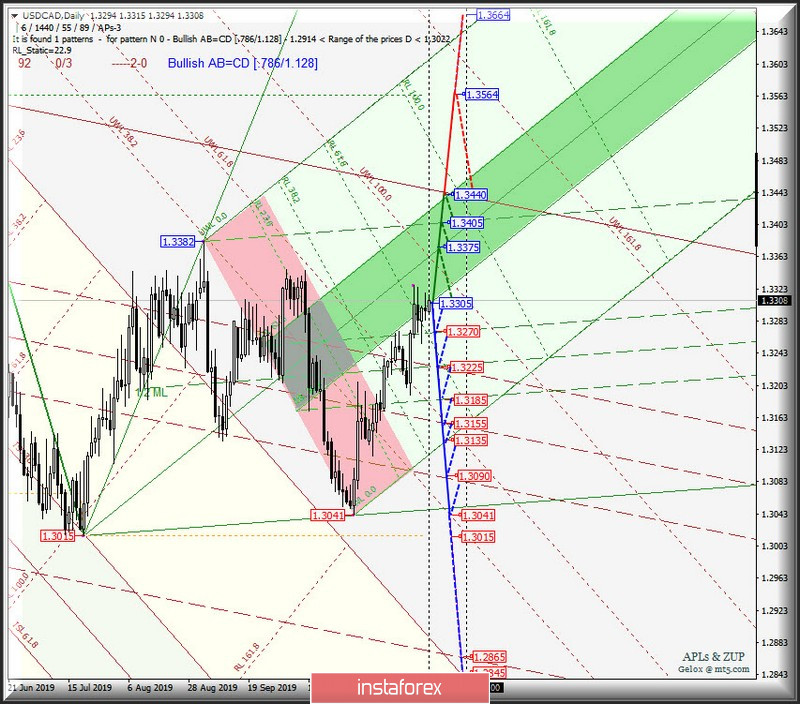
US dollar vs Canadian dollar
Starting November 27, 2019, the development of the movement of the Canadian dollar USD / CAD will be determined by the development and direction of the breakdown of the boundaries of the equilibrium zone (1.3305 - 1.3375 - 1.3440) of the Minuette operational scale forks. The markup of movement inside this equilibrium zone is shown in the animated chart.
In case of breakdown of the upper boundary of ISL61.8 (resistance level of 1.3440) of the equilibrium zone of the Minuette operational scale forks, it will be possible to continue the upward movement of USD / CAD to the local maximum 1.3564.
However, if you return below the support level 1.3305 (lower boundary of the ISL38.2 equilibrium zone of the Minuette operational scale forks), the USD / CAD movement will continue to the boundaries of the 1/2 Median Line channels of the operational scale - Minuette (1.3270 - 1.3225 - 1.3185) and Minor (1.3225 - 1.355 - 1.3090) with the prospect of reaching a local minimum of 1.3041.
From November 27, 2019, we look at the markup of the USD / CAD movement options on the animated chart.
____________________
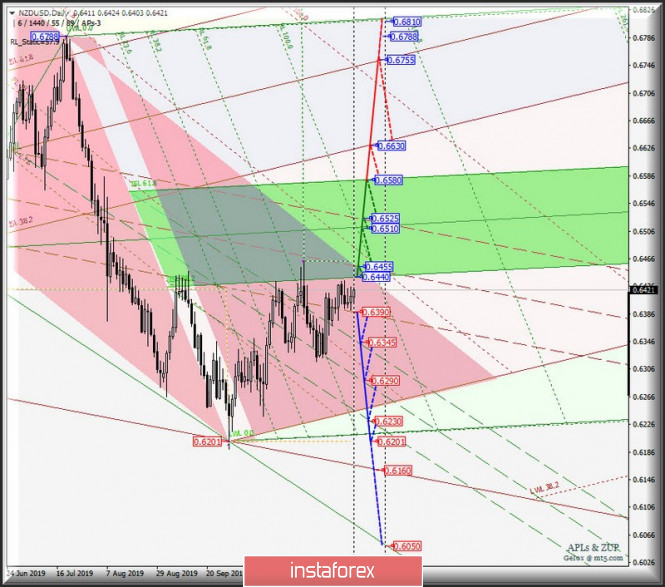
New Zealand dollar vs US dollar
Development and the breakdown direction of the range :
- resistance level of 0.6440 (lower boundary of the ISL38.2 equilibrium zone of the Minuette operational scale forks);
- support level of 0.6390 (the lower boundary of the 1/2 Median Line channel of the Minor operational scale forks).
The breakdown of the lower boundary of the 1/2 Median Line Minor channel (support level of 0.6390) is a continuation of the downward movement of NZD / USD to the boundaries of the 1/2 Median Line Minuette channel (0.6345 - 0.6290 - 0.6230) with the prospect of updating the local minimum 0.6201.
Consecutive breakdown of resistance levels :
- 0.6440 - lower boundary of the ISL38.2 equilibrium zone of the Minuette operational scale forks;
- 0.6455 - 1/2 Median Line Minor;
will make the development of the movement of the New Zealand dollar in the equilibrium zone relevant (0.6440 - 0.6510 - 0.6580)of the Minuette operational scale forks, and in case of breakdown ISL61.8 Minuette (0.6580), it will become possible for the price of this instrument to reach the lower border of ISL38.2 (0.6630) equilibrium zone of the Minor operational scale forks and the 1/2 Median Line Minor (0.6755).
From November 27, 2019, we look at the markup of the NZD / USD movement on the animated chart.
____________________
The review was prepared without taking into account the news background. Thus, the opening of trading sessions of major financial centers does not serve as a guide to action (placing orders "sell" or " buy").
The formula for calculating the dollar index:
USDX = 50.14348112 * USDEUR0.576 * USDJPY0.136 * USDGBP0. 119 * USDCAD0.091 * USDSEK0.042 * USDCHF0.036.
where the power coefficients correspond to the weights of the currencies in the basket:
Euro - 57.6%;
Yen - 13.6%;
Pound Sterling - 11.9%;
Canadian dollar - 9.1%;
Swedish Krona - 4.2%;
Swiss franc - 3.6%.
The first coefficient in the formula leads the index to 100 at the start date of the countdown - March 1973, when the main currencies began to be freely quoted relative to each other.