empty
12.01.2024 04:26 PM
Trading Signals for BTC (Bitcoin) on January 12-16, 2024: sell below $46,400 (21 SMA - rebound)

This image is no longer relevant

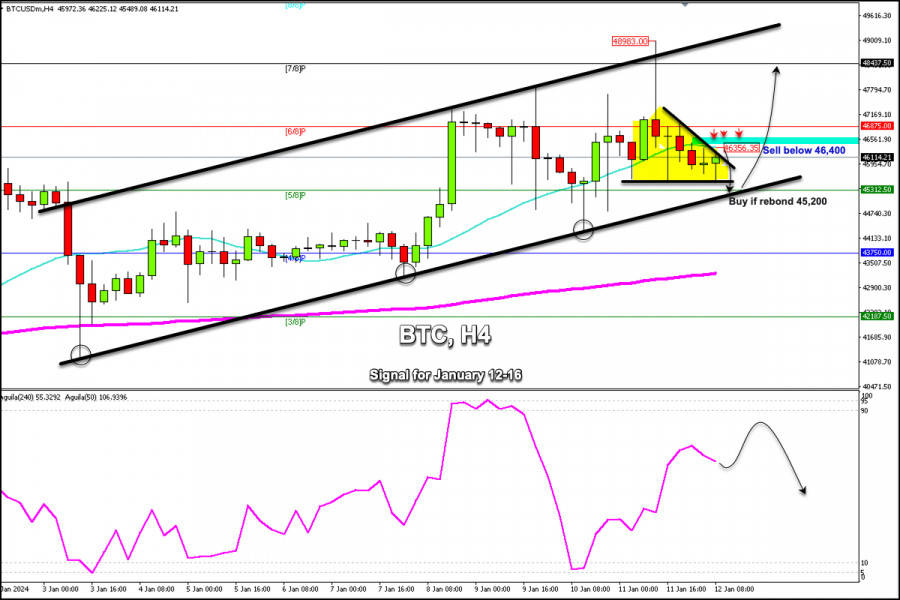
In the morning of the American session, Bitcoin (BTC) is trading at around 46,114, bouncing after having reached the weekly support of around 45,489. In the H4 chart, we can see that Bitcoin has been moving within an uptrend channel since January 3. If it trades above 46,400 again, it could resume its bullish cycle and BTC could reach 48,437.

Given that BTC is under strong bearish pressure after having reached the maximum of 48,983, the price could consolidate below the 21 SMA located at 46,356 in the coming hours. BTC may also trade within a range zone below 6/8 Murray and above the bottom of the uptrend channel around 45,200, this level coincides with 5/8 Murray which could offer good support and an opportunity to buy

According to the H4 chart, Bitcoin still maintains bullish momentum and we hope that it could reach the psychological level of $50,000 in the coming days. For this, the key and condition will be to settle above 6/8 Murray located at 46,875.

If this condition is not met, Bitcoin could come under strong downward pressure and we could expect it to reach 4/8 Murray located at 43,750. In turn, this would cause the bullish trend channel to break and open the way for a new technical correction cycle. As a result, BTC could reach the levels of the 200 EMA located at 43,150 and finally at 3/8 Murray at 42,187.

Dimitrios Zappas,
Analytical expert of InstaForex
© 2007-2025
Summary
Urgency
Analytic
Dimitrios Zappas
Start trade
Earn on cryptocurrency rate changes with InstaForex
Download MetaTrader 4 and open your first trade
  • Grand Choice
    Contest by
    InstaForex
    InstaForex always strives to help you
    fulfill your biggest dreams.
    JOIN CONTEST

Recommended Stories

EUR/USD. Negative News for the Dollar Will Support the Pair's Growth

The pair is consolidating above the 1.1685 support level as the market awaits US inflation data and the outcome of next week's FOMC monetary policy meeting. Unlike the Federal Reserve

Pati Gani 11:13 2025-09-11 UTC+2

EUR/USD. September 11. The ECB Is Not an Enemy of the Euro

Good day, traders! On Wednesday, EUR/USD made several bounces from the 76.4% correction level at 1.1695, but as of Thursday morning, it has returned to test this level again. Another

Samir Klishi 10:36 2025-09-11 UTC+2

GBP/USD. September 11. US Inflation Represents a New Threat to the Dollar

Good day, traders! On the hourly chart, GBP/USD on Wednesday traded exactly between the 1.3482 and 1.3587 levels. Thus, no new trading signals or ideas emerged—one of those two levels

Samir Klishi 09:38 2025-09-11 UTC+2

Although There is Limited Upside Potential, Natural Gas is Likely to Weaken Towards Its Nearest Support Level Today. Thursday, 11 September 2025.

[Natural Gas] – [Thursday, 11 September 2025] Although there is potential for strengthening, as long as it does not break and close above 3.052, Natural Gas will return

Arief Makmur 08:05 2025-09-11 UTC+2

Nasdaq 100 Index Has the Potential to Strengthen Towards Its Nearest Resistance Level Today. Thursday, 11 September 2025.

[Nasdaq 100 Index] – [Thursday, 11 September 2025] Although there is a potential for correction as the RSI is at the Neutral-Bearish level, but as long as it does

Arief Makmur 08:05 2025-09-11 UTC+2

EUR/USD Forecast for September 11, 2025

EUR/USD Yesterday's US Producer Price Index (PPI) data had little effect on the dollar (Dollar Index -0.01%) but notably shifted the probability of a December rate cut to 3.75% from

Laurie Bailey 05:14 2025-09-11 UTC+2

GBP/USD Forecast for September 11, 2025

GBP/USD On Wednesday, similar to Tuesday, the British pound managed to rise above the daily MACD indicator line, albeit only with its upper shadow. The day closed at the opening

Laurie Bailey 05:14 2025-09-11 UTC+2

EUR/JPY Forecast for September 11, 2025

EUR/JPY The EUR/JPY pair has reversed for the second time from the upper boundary of the price channel and is now holding below the MACD line on the daily chart

Laurie Bailey 05:14 2025-09-11 UTC+2

Trading Signals for BITCOIN for September 10-12, 2025: sell below $ 114,500 (21 SMA - 4/8 Murray)

On the other hand, if BTC trades within the uptrend channel at about 114,500, it will be seen as a sell signal, with targets at 112,500 and 111,800, the bottom

Dimitrios Zappas 18:11 2025-09-10 UTC+2

Trading Signals for GOLD for September 10-12, 2025: sell below $ 3,360 (21 SMA - 61.8% Fibonnaci)

Gold, after reaching its high around 3,674 and its low at 3,619, made a technical correction to 61.8%, around 3,657. On the H4 chart, we see that gold is resuming

Dimitrios Zappas 18:08 2025-09-10 UTC+2
Can't speak right now?
Ask your question in the chat.
Widget callback
 

Dear visitor,

Your IP address shows that you are currently located in the USA. If you are a resident of the United States, you are prohibited from using the services of InstaFintech Group including online trading, online transfers, deposit/withdrawal of funds, etc.

If you think you are seeing this message by mistake and your location is not the US, kindly proceed to the website. Otherwise, you must leave the website in order to comply with government restrictions.

Why does your IP address show your location as the USA?

  • - you are using a VPN provided by a hosting company based in the United States;
  • - your IP does not have proper WHOIS records;
  • - an error occurred in the WHOIS geolocation database.

Please confirm whether you are a US resident or not by clicking the relevant button below. If you choose the wrong option, being a US resident, you will not be able to open an account with InstaForex anyway.

We are sorry for any inconvenience caused by this message.