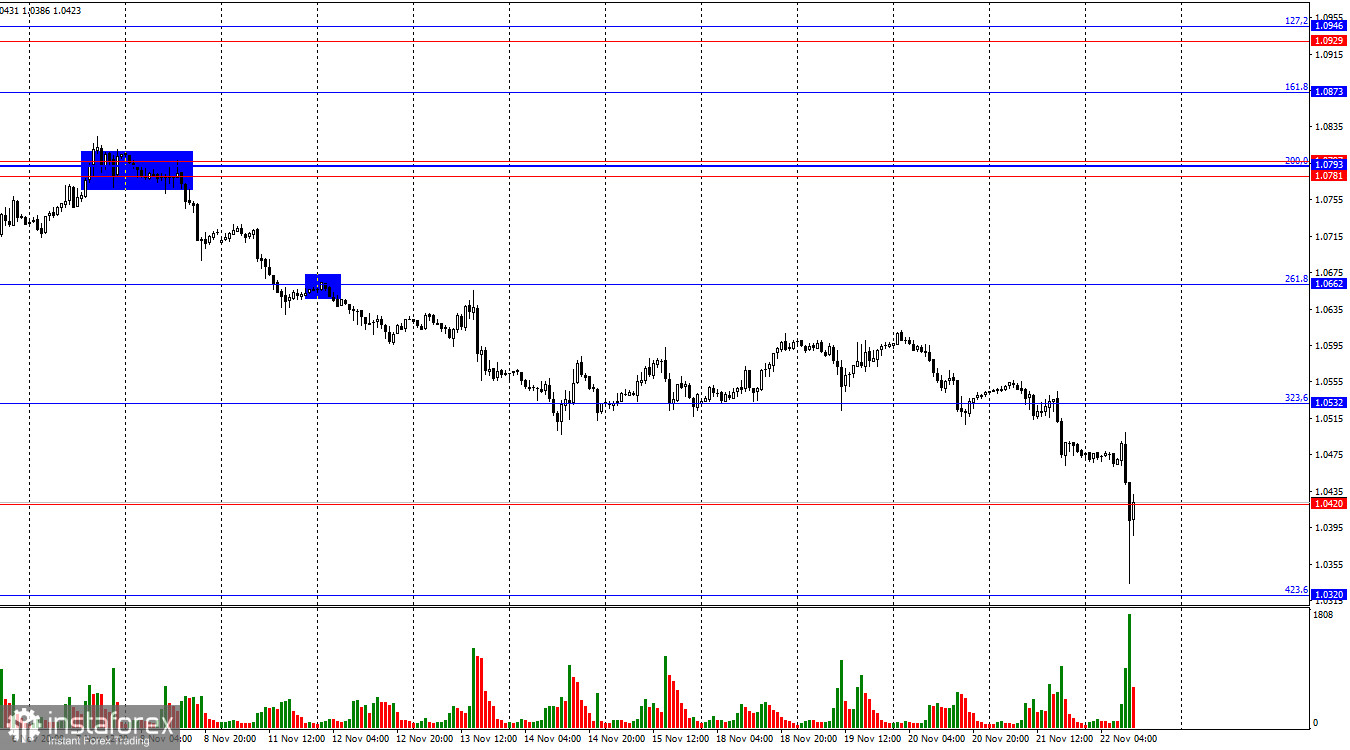
On Thursday, the EUR/USD pair consolidated below the 323.6% Fibonacci level at 1.0532 and continued its decline. Today, the price reached the 1.0420 level and came close to the 423.6% Fibonacci level at 1.0320. In my view, bears have started locking in profits, suggesting a potential pullback. The sharp decline in the euro today is often a sign of a final downward move.
The wave structure is clear. The last completed upward wave failed to surpass the peak of the previous wave, while the ongoing downward wave has easily broken through the last two lows. This indicates the pair is continuing its bearish trend. Bulls have lost control of the market entirely. Regaining it would require significant effort, which seems improbable in the near term. For the current trend to reverse, the pair would need to rise above the 1.0800 level—a scenario that appears unlikely in the short term.
On Thursday, the economic backdrop for the euro was not particularly favorable or eventful for traders. Several US reports triggered further strength in the US dollar, though the data itself was not overwhelmingly positive. The number of jobless claims was 213,000, slightly better than the expected 220,000. The Philadelphia PMI came in at -5.5, against forecasts of 8 to 10, while new home sales reached 3.96 million compared to expectations of 3.93 million. Despite this, the US dollar rallied throughout the day.
Today, however, the euro faced a more significant setback. Business activity indices for Germany and the EU's manufacturing sectors were largely in line with expectations, but the services sector delivered surprisingly weaker results. The market reacted with heavy euro selling, resulting in a drop of 150 points. This decline was excessive and disproportionate to the data, suggesting it was the final push by the bears before they pause for some time.
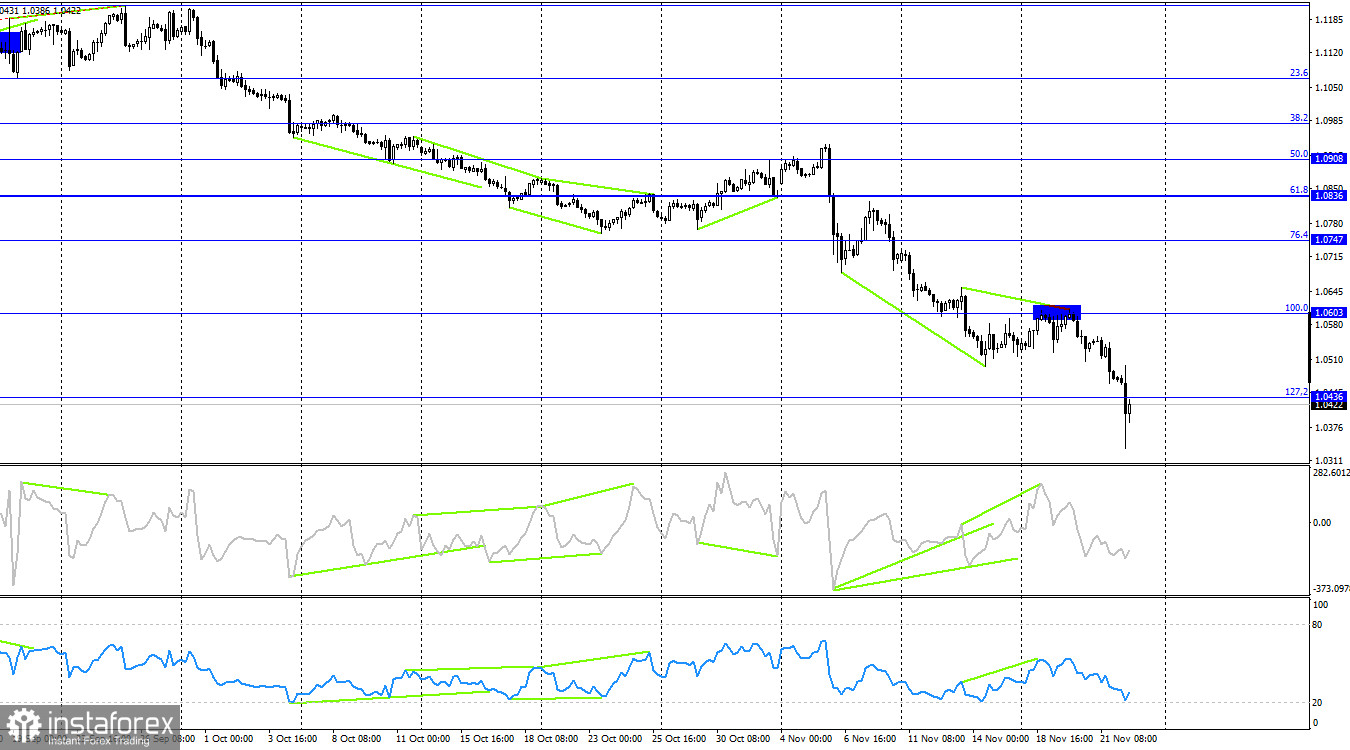
On the 4-hour chart, the pair retraced to the 100% Fibonacci corrective level at 1.0603, rebounded from it, and turned in favor of the US dollar. At the same time, bearish divergence formed on the CCI and RSI indicators. This provided several signals that the euro's decline had resumed, which were quickly executed. The pair has already closed below the 1.0436 level, paving the way for further declines toward the next Fibonacci corrective level of 161.8% at 1.0225.
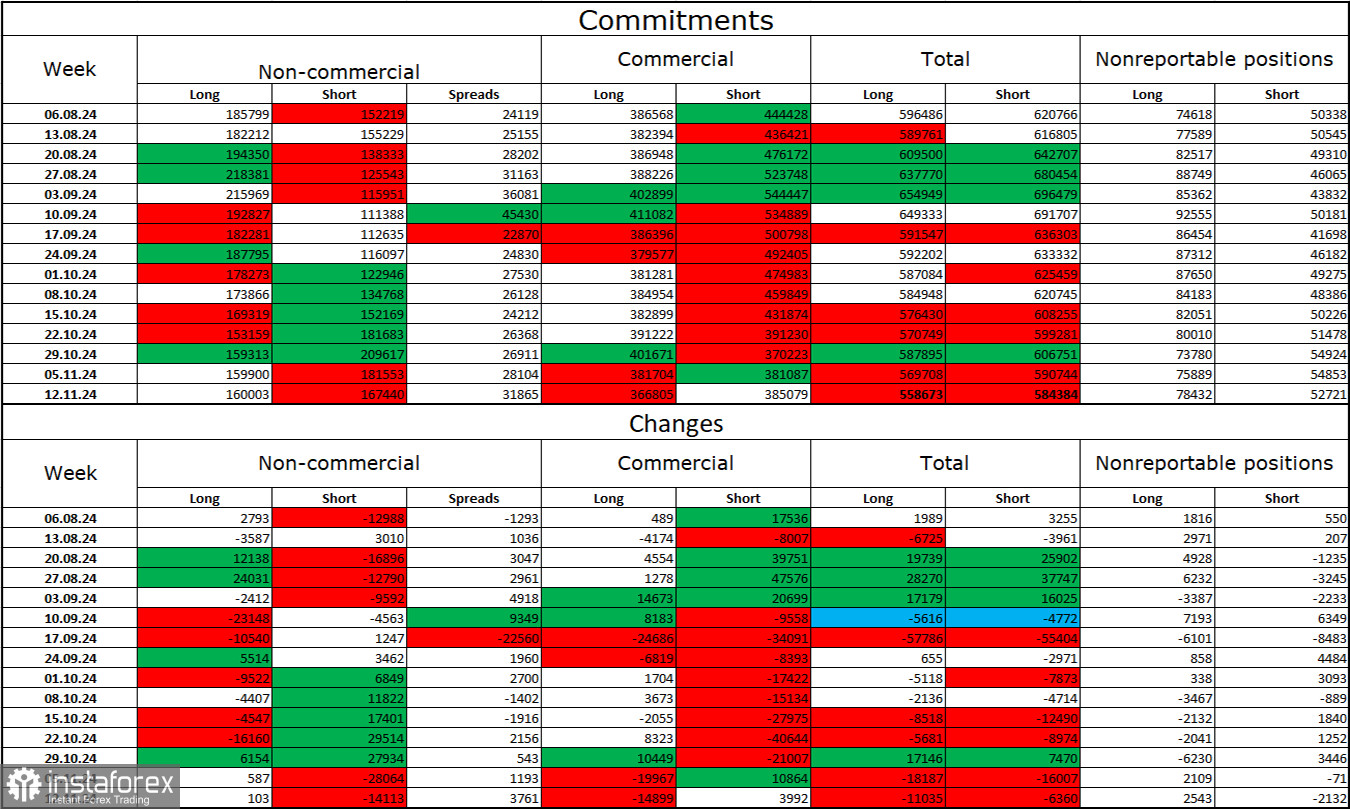
Commitments of Traders (COT) Report
During the last reporting week, speculators opened 103 long positions and closed 14,113 short positions. The sentiment of the "Non-commercial" group has shifted to a bearish stance. Speculators now hold 160,000 long positions and 167,000 short positions.
For eight consecutive weeks, large market participants have been shedding the euro. This trend signals either the emergence of a new bearish movement or, at the very least, a strong global correction. The key factor driving the dollar's previous decline—expectations of a dovish shift by the FOMC—has already been priced in. With no immediate reason for a mass selloff of the dollar, the likelihood of continued USD strength remains higher. Technical analysis also supports the formation of a long-term bearish trend. Therefore, I anticipate a prolonged decline in the EUR/USD pair. The latest COT report provides no indication of a shift toward bullish sentiment.
Economic Calendar for the US and EU:
- EU: Germany GDP Change (07:00 UTC)
- EU: Germany Manufacturing PMI (08:30 UTC)
- EU: Germany Services PMI (08:30 UTC)
- EU: Eurozone Manufacturing PMI (09:00 UTC)
- EU: Eurozone Services PMI (09:00 UTC)
- US: Manufacturing PMI (14:45 UTC)
- US: Services PMI (14:45 UTC)
- US: University of Michigan Consumer Sentiment Index (15:00 UTC)
On November 23, the economic calendar includes several significant entries. These events could exert a notable influence on market sentiment for the remainder of the day.
EUR/USD Forecast and Trading Tips
Sales of the pair were possible with a rebound from the 1.0781–1.0797 zone on the hourly chart, targeting 1.0662. This target was achieved. Closing below this level allowed traders to maintain sales with targets at 1.0603 and 1.0532, both of which were also reached. A rebound from the 1.0603 level indicated opportunities for additional sales with targets at 1.0532 and 1.0420. These targets have been met as well.
I do not recommend buying the pair for now, despite the possibility of bears taking a short pause.
Fibonacci retracement levels are built from 1.1003 to 1.1214 on the hourly chart and from 1.0603 to 1.1214 on the 4-hour chart.