empty
15.07.2025 11:30 AM
Forecast for GBP/USD on July 15, 2025

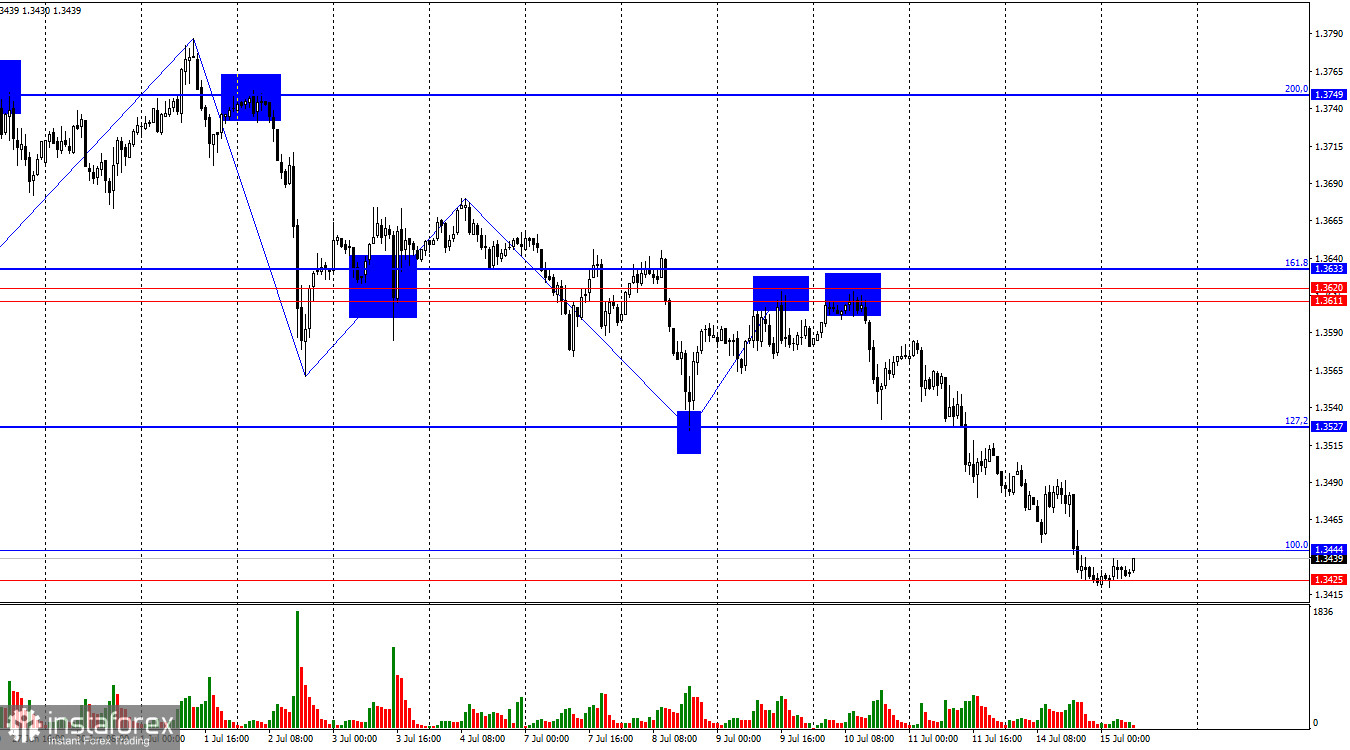
On the hourly chart, the GBP/USD pair continued to decline on Monday and by the end of the day had reached the support zone of 1.3425–1.3444. A rebound from this zone would work in favor of the British pound and lead to a rise toward the 127.2% Fibonacci level at 1.3527. A close below the 1.3425–1.3444 zone would increase the likelihood of a further decline toward the next support zone at 1.3357–1.3373.

This image is no longer relevant

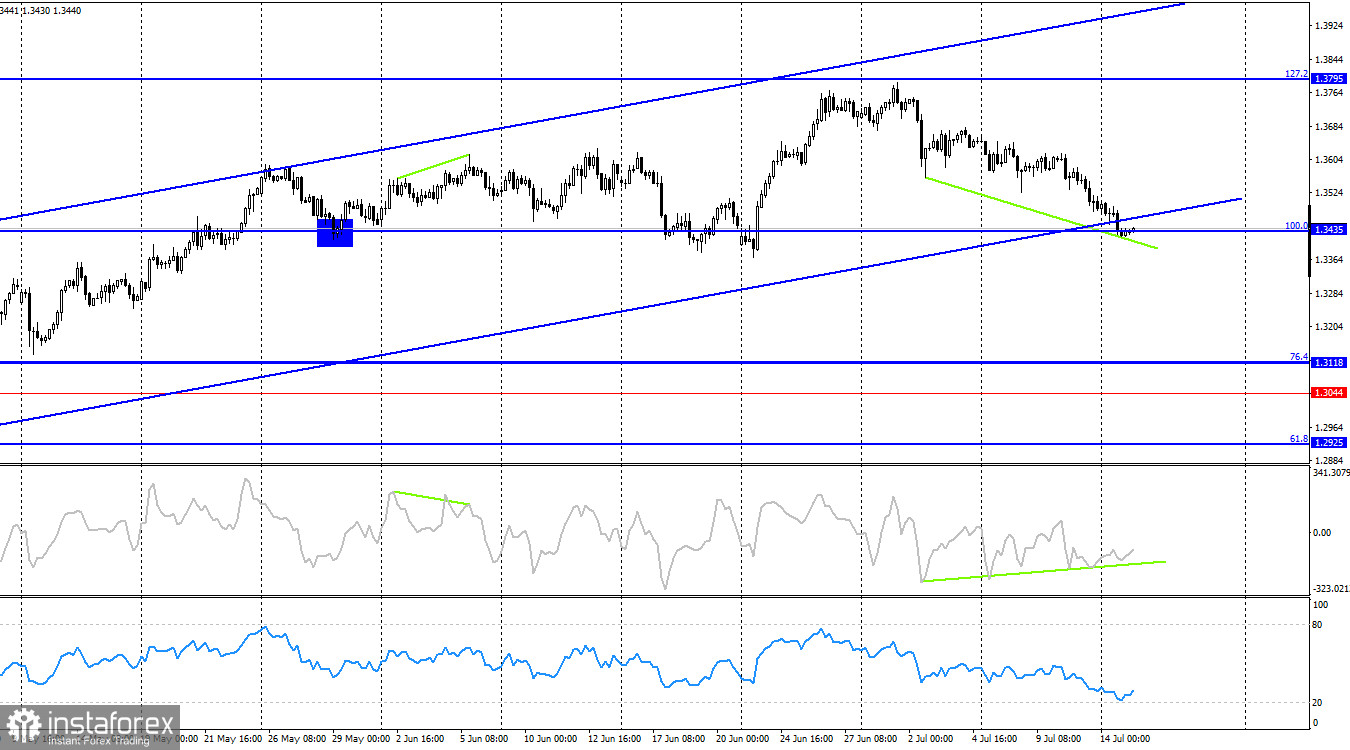
The wave structure still indicates that the bullish trend remains intact. The last completed upward wave broke above the previous wave's high, while the three new downward waves have not updated that low. Thus, what we are seeing now is not a trend reversal to bearish, but rather a series of waves within a fairly strong correction that traders haven't seen in quite some time. Bears still lack compelling reasons to go on the offensive, as Trump's trade war continues to escalate by the day.

Today, the U.S. will release the June inflation report, which is of great interest to traders but won't change the fundamentals of the Fed's monetary policy. As a reminder, Trump continues to pressure the Fed and Jerome Powell personally to lower the interest rate by at least 3%. Trump needs a "soft" monetary policy to offset the negative effects of tariffs. However, the Fed and Powell have their own mandates—price stability and full employment—which do not particularly concern the U.S. president. Therefore, the Fed refuses to cut rates and instead emphasizes accelerating inflation in recent months, which it expects to continue rising through the end of the year due to Trump's tariffs. Thus, an inflation increase today would confirm Powell's concerns about accelerating consumer price growth. If that happens, the chances of a rate cut in July or September would drop to nearly zero. I wouldn't say this information is critically important for the dollar, which has been declining since the beginning of the year for reasons unrelated to inflation or Fed policy. Nevertheless, traders might take this report into account.

This image is no longer relevant

On the 4-hour chart, the pair reversed in favor of the U.S. dollar just a few points short of the 127.2% retracement level at 1.3795. Since the decline was unexpected and may be short-lived, I believe it is better to analyze the hourly chart for now. A rebound from the 100.0% retracement level at 1.3435 would favor a resumption of the bullish trend. No developing divergences are observed on any indicator.

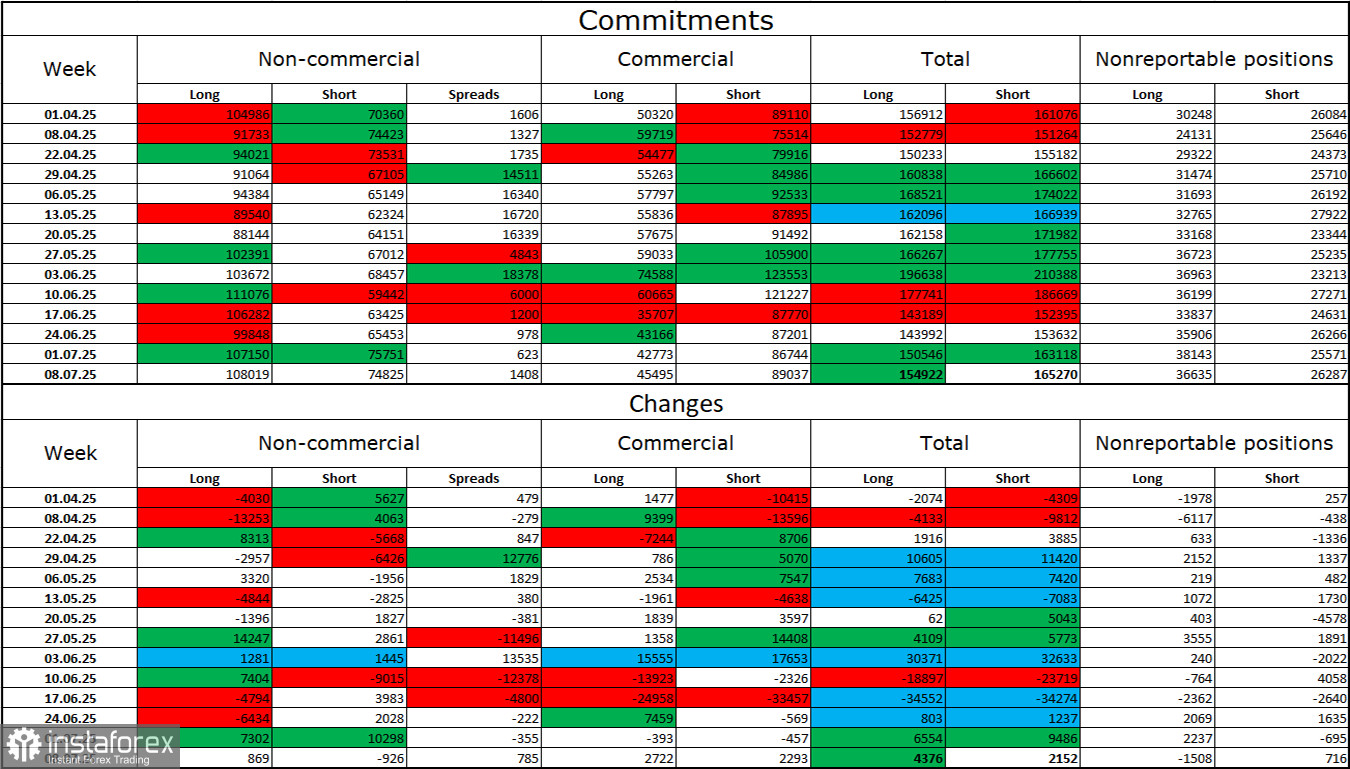
Commitments of Traders (COT) Report:

This image is no longer relevant

The sentiment of the "Non-commercial" trader category became slightly less bullish over the latest reporting week. The number of long positions held by speculators increased by 7,302, while short positions rose by 10,298. However, bears have long since lost the upper hand in the market and currently stand no chance of success. The gap between long and short positions is 32,000 in favor of the bulls: 107,000 versus 75,000.

In my view, the British pound still faces downside risks, but events in 2025 have completely shifted the market's long-term direction. Over the past four months, the number of long positions has grown from 65,000 to 107,000, while short positions have decreased from 76,000 to 75,000. Under Donald Trump, confidence in the dollar has weakened, and the COT reports show that traders are reluctant to buy it. Thus, regardless of the broader informational backdrop, the dollar continues to decline amid developments surrounding Trump.

News calendar for the U.S. and U.K.:

U.S. – Consumer Price Index (12:30 UTC)U.K. – Speech by Bank of England Governor Andrew Bailey (20:00 UTC)

On Tuesday, the economic calendar features two very important events. The impact of the news background on trader sentiment is expected to manifest in the second half of the day.

GBP/USD forecast and trading tips:

Selling opportunities were present upon a rebound from the 1.3611–1.3633 zone with a target of 1.3527. That target has been achieved. New sell opportunities emerged following a close below 1.3527 on the hourly chart with a target of 1.3444. That target has also been met. Buy positions can be considered upon a rebound from the 1.3425–1.3444 zone with targets at 1.3527 and the 1.3611–1.3633 zone.

Fibonacci level grids are constructed from 1.3446–1.3139 on the hourly chart and from 1.3431–1.2104 on the 4-hour chart.

Samir Klishi,
Analytical expert of InstaForex
© 2007-2025
Summary
Urgency
Analytic
Grigory Sokolov
Start trade
Earn on cryptocurrency rate changes with InstaForex
Download MetaTrader 4 and open your first trade
  • Grand Choice
    Contest by
    InstaForex
    InstaForex always strives to help you
    fulfill your biggest dreams.
    JOIN CONTEST

Recommended Stories

Silver forecast for August 13, 2025

Yesterday, silver gained 0.41%. The price has returned above the balance indicator line, and the Marlin oscillator, which is close to moving into the territory of an upward trend

Laurie Bailey 04:59 2025-08-13 UTC+2

Trading Signals for GOLD (XAU/USD) for August 12-15, 2025: buy above $3,341 or sell below $3,335 (21 SMA - 200 EMA)

If gold falls below 3,340, the outlook could be negative. It could then resume its downward movement, and we could expect the instrument to reach 5/8 Murray at 3,320

Dimitrios Zappas 13:34 2025-08-12 UTC+2

Trading Signals for EUR/USD for August 12-15, 2025: sell below 1.1647 (200 EMA - 7/8 Murray)

The euro is trading around 1.1618, above the 200 EMA and above the 6/8 Murray, recovering some of the previous day's losses but showing signs of exhaustion. If the euro

Dimitrios Zappas 13:34 2025-08-12 UTC+2

XAU/USD. Analysis and Forecast

From a technical standpoint, gold is managing to hold above the 200-period Simple Moving Average (SMA) on the 4-hour chart, which serves as a key support level. Given that oscillators

Irina Yanina 12:57 2025-08-12 UTC+2

Forecast for EUR/USD on August 12, 2025

On Monday, the EUR/USD pair declined to the 50.0% retracement level at 1.1590 and rebounded from it. As a result, a reversal in favor of the euro was completed

Samir Klishi 11:46 2025-08-12 UTC+2

Forecast for GBP/USD on August 12, 2025

On the hourly chart, GBP/USD on Monday declined to the support area of 1.3416–1.3425 and reversed near it in favor of the pound. This resumed the upward movement toward

Samir Klishi 11:23 2025-08-12 UTC+2

GBP/USD. Indicator Analysis on August 12, 2025

On Monday, the pair moved downward from the 5-day EMA at 1.3400 (thin red line) and then moved upward, closing the daily candle at 1.3428. Today, it will attempt

Stefan Doll 10:59 2025-08-12 UTC+2

Forex forecast 12/08/2025: EUR/USD, USD/JPY, GBP/USD, Gold, Ethereum and Bitcoin

Useful links: My other articles are available in this section InstaForex course for beginners Popular Analytics Open trading account Important: The begginers in forex trading need to be very careful

Sebastian Seliga 10:58 2025-08-12 UTC+2

EUR/USD. Indicator Analysis on August 12, 2025

On Monday, the pair moved downward from the 50% retracement level at 1.1594 (yellow dashed line) and then moved up, closing the daily candle at 1.1614. Today, the movement

Stefan Doll 10:54 2025-08-12 UTC+2

Although the Lonnie bias remains strong, the appearance of a divergence on the RSI(14) indicates a correction. Tuesday, August 12, 2025.

[USD/CAD] – [Tuesday, August 12, 2025] Despite the appearance of divergence between the RSI(14) and the Lonnie price movements, the golden cross between EMA(50) and the EMA(200) indicates continued strengthening

Arief Makmur 07:52 2025-08-12 UTC+2
Can't speak right now?
Ask your question in the chat.
Widget callback
 

Dear visitor,

Your IP address shows that you are currently located in the USA. If you are a resident of the United States, you are prohibited from using the services of InstaFintech Group including online trading, online transfers, deposit/withdrawal of funds, etc.

If you think you are seeing this message by mistake and your location is not the US, kindly proceed to the website. Otherwise, you must leave the website in order to comply with government restrictions.

Why does your IP address show your location as the USA?

  • - you are using a VPN provided by a hosting company based in the United States;
  • - your IP does not have proper WHOIS records;
  • - an error occurred in the WHOIS geolocation database.

Please confirm whether you are a US resident or not by clicking the relevant button below. If you choose the wrong option, being a US resident, you will not be able to open an account with InstaForex anyway.

We are sorry for any inconvenience caused by this message.